Section 3.3. Large-Scale Channel Modeling
|
3.3. Large-Scale Channel ModelingLarge-scale channel modeling involves modeling the signal attenuation with distance. This large-scale attenuation is generally referred to as path loss. Path loss is a fundamental characteristic of electromagnetic wave propagation and is incorporated in the system design, viz link budgets, to predict expected received power. Traditionally, free-space path loss for narrowband signals is examined using the Friis transmission formula that provides a means for predicting the received power. For a constant frequency, the Friis transmission formula predicts that the received signal power will fall off with the square of the distance between the transmitter and receiver. Additionally, the formula predicts that the received signal power will decrease with the square of increasing frequency due to the assumption of constant gain antennas, which has little effect on narrowband systems. However, the large bandwidths of UWB signals, typically > 500 MHz, coupled with this definition of path loss, suggests that the channel introduces a path loss that varies across the band of the signal. This clearly would cause frequency dependent attenuation and thus distort the pulse shape. Thus, the Friis transmission formula needs to be examined more closely to justify its application to UWB. 3.3.1. Free-Space Path Loss Modeling: The Friis Transmission FormulaThe basis for the Friis transmission formula is the flux density of a transmitting source. The flux density is given by Equation 3.1 where EIRP is the Effective Isotropic Radiated Power, which assumes that the power is radiated equally in all directions by the transmitter, and r is the radius of a sphere, the surface of which the flux density is being calculated [4]. Equation (3.1) shows that the flux density assumes no frequency dependence, and that with a doubling of distance the flux decreases by a factor of four. This flux density can then be used to determine received power, Pr, by multiplying by Ae, the effective aperture of the receive antenna, resulting in Equation 3.2 The Friis equation is typically stated in terms of the gains of the antennas, where the gain is related to the effective aperture of the antenna, Ae, by [4] Equation 3.3 Rearranging (3.3) to solve for Ae, and substituting the result into (3.2) gives Equation 3.4 Further, EIRP can be expressed as EIRP =PtGt, where Pt is the transmit power and Gt is the transmit antenna gain. This results in the standard Friis transmission formula given as Equation 3.5 The term Equation 3.6 where Aet is the effective aperture of the transmit antenna. This flux density can be used in the same manner as in (3.5) to give the expected received power Equation 3.7 This result again shows frequency dependence, but here the received power increases with frequency. For systems with a constant gain antenna on one end of the link and a constant aperture antenna on the other end of the link, the received power is independent of frequency, as shown in (3.8) and (3.9). Constant aperture transmit/constant gain receive: Equation 3.8 Constant aperture transmit/constant gain receive: Equation 3.9 The point of this development is that while the received power may be dependent on frequency, this is due to the antennas, not the path per se. The path loss, or more accurately the spreading loss, in free-space is not frequency dependent. This can be seen by taking line-of-sight (LOS) measurements using UWB signals with two different antennas [72]. A 200 ps Gaussian pulse was generated (Figure 3.1) and used in conjunction with wideband biconical antennas. The received pulse was measured at several distances in a LOS environment with any multipath being eliminated through time gating. The received pulses are plotted in Figure 3.2. The received waveforms are normalized by distance.[1] It is expected that if no frequency dependency exists in the path, all the pulses will retain the same pulse shape. Figure 3.2 shows that to within measurement error, the pulses do indeed maintain the same shape for distances between 1 m and 20 m. This experiment was repeated using the same generated pulse, but with TEM horn antennas at the transmitter and receiver. The results are plotted in Figure 3.3. Again, the pulse shape is consistent with distance. Note that the received pulse is not necessarily the same as the generated pulse. This is due to the fact that the antenna response is frequency dependent. In fact, the two antennas have very different responses, as will be discussed in Chapter 4, "Antennas." However, the impact of the antennas is similar regardless of distance. Thus, it is not necessary to accommodate frequency dependence into the path loss for UWB signals, at least in LOS environments. Frequency dependence must be taken into account when considering the received power due to the antennas used, but not for the path loss, at least not for free-space or LOS propagation. This is a direct consequence of the fact that all antennas, regardless of their characteristics or frequency of operation, have their power flux density varying as
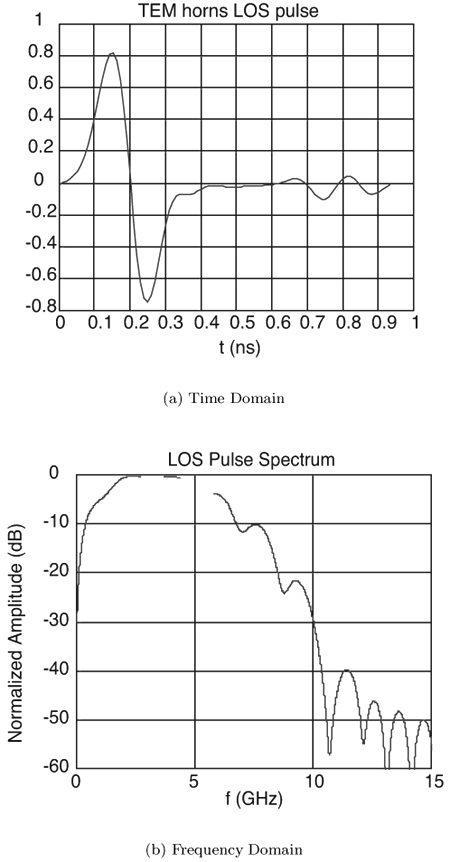
Equation 3.10 where the frequency dependence due to antenna effects is captured entirely in the reference measurement, Po. Figure 3.1. Generated Gaussian Pulse of ~200 ps Duration for Path Loss Experiment.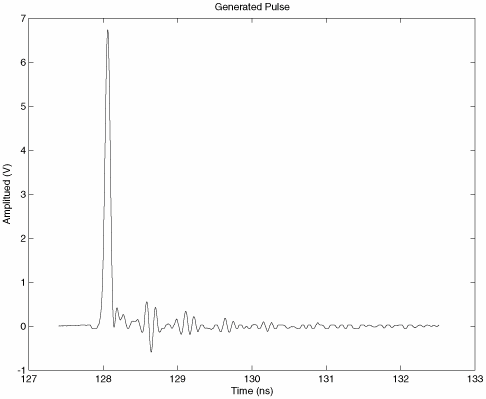 Figure 3.2. LOS-Received Pulses Normalized According to Their Respective Distances Using Bicone Antennas and Gaussian Pulse of Figure 3.1. (Legend Refers to Measurement Distance in Meters.)SOURCE: R. M. Buehrer, A. Safaai-Jazi, W. A. Davis, and D. Sweeney, "Characterization of the UWB Channel,"Proc. IEEE Conference on Ultra Wideband Systems and Technologies [5]. © IEEE, 2003. Used by permission. 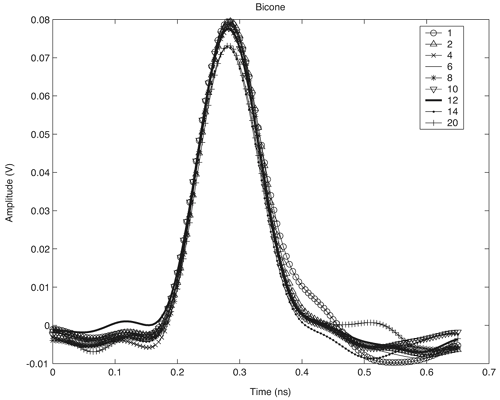 Figure 3.3. LOS-Received Pulses Normalized According to Their Respective Distances Using TEM Horn Antennas and Gaussian Pulse of Figure 3.1. (Legend Refers to Measurement Distance in Meters.)SOURCE: R. M. Buehrer, A. Safaai-Jazi, W. A. Davis, and D. Sweeney, "Characterization of the UWB Channel,"Proc. IEEE Conference on Ultra Wideband Systems and Technologies [5]. © IEEE, 2003. Used by permission. 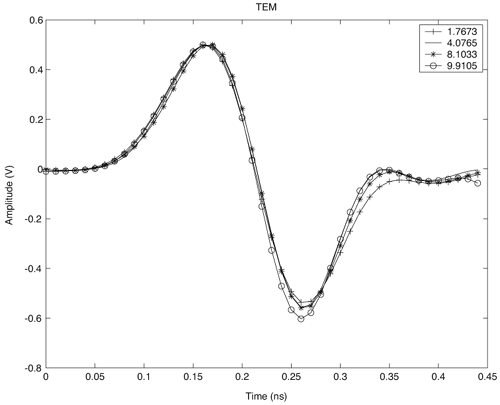 3.3.2. Path Loss Modeling for Non-Free-Space EnvironmentsThe analysis given in the previous section provides the justification for applying the traditional path loss model to the analysis of UWB signals in free-space. The frequency dependence can be captured in a reference power, Po, received at a close-in reference distance. In other words, because path loss is not frequency dependent, the traditional narrowband models apply. However, most environments of interest do not involve simple free-space propagation. Rather, the path between the transmitter and receiver will have other objects in the environment, perhaps completely blocking the LOS path. Even if the LOS path is clear of obstructions, objects surrounding the transmitter and receiver can greatly influence the average signal strength. It has been shown in many experiments and with theoretical models that the average path loss (both indoors and outdoors) for narrowband systems increases logarithmically with distance [23] Equation 3.11 where do is again the reference distance, typically 1 m for indoor measurements, and Equation 3.12 where Pr(do) is the received power at a reference distance. This is analogous to (3.10) with the difference being that the path loss exponent is not 2. The question is: How does UWB change this relationship? The main point at which frequency dependence enters the equation is through the antennas. By defining path loss relative to a reference power measurement, we have eliminated this factor. The antenna effects are subsumed into the reference measurement. The second place where frequency dependence can enter the equation is in the path loss exponent n. Due to the fact that diffraction, material penetration, and other effects are frequency dependent, the path loss exponent could change with frequency. One approach to this problem is to assume that the frequency and distance factors are independent [76]. Equation 3.13 A second approach would be simply to make the path loss exponent n a function of the frequency. Currently, there is no clear consensus on the dependence of path loss on frequency (excluding antenna effects). It was found in [5] that frequency dependent behavior was not observable in the path loss. This can be seen in Figure 3.4 (taken from [5, 73]), which plots the path loss exponent and standard deviation versus frequency over the range of 1-10 GHz. The figure contains LOS and NLOS environments using bicone and TEM horn antennas. It can be seen that the path loss exponent does not vary with frequency. The standard deviation of the path loss exponent over the band was found to be less than 0.1. It should be noted, however, that the measurements were taken at relatively short distances (generally less than 10 m). It is very possible that larger distances may reveal frequency dependencies for NLOS channels due to the frequency dependency of many materials. We will discuss frequency dependence in more detail in Section 3.3.3. If frequency dependence is restricted to the antenna, the path loss can be defined as in the narrowband case using (3.11). Note that the reference measurement is important to define when determining the path loss model. The reference point can be defined to include multipath effects or can be defined to be the received power in free-space. Both are commonly used in conventional narrow/wideband path loss models. Defining the reference measurement to be free-space has the advantage that it is possible to directly calculate the reference point, thus eliminating the need for a reference measurement. This is somewhat more complicated in UWB systems than in narrow-band systems. When defining the reference measurement to include environmental factors (such as multipath) the reference point becomes environment-specific. In such a case, statistical characterization of the reference may be useful. Figure 3.4. Path Loss Exponent and Standard Deviation Measured at Different Frequencies.SOURCE: B. Donlan and R. M. Buehrer, "The UWB Indoor Channel: Large and Small-Scale Modeling," submitted to IEEE Transactions on Wireless Communications [73]. © IEEE, 2004. Used by permission. 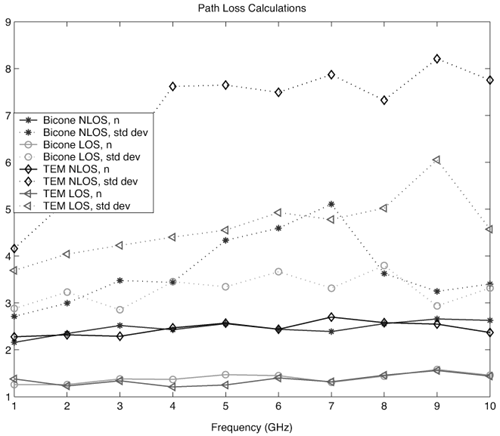 Note that if free-space attenuation is to be used for the reference point in UWB, care must be taken in determining this value. It may be obtained via calculation, provided that sufficient information concerning the antennas is available. It may also be obtained via measurement, provided that all multipath effects are eliminated. For example, in [5] and [6] path loss was calculated with respect to free-space path loss at 1 m. The reference measurement was taken at do = 1 m, and time gating was used to obtain only the LOS component and thus eliminate multipath effects. This makes the path loss calculations relative to free-space at 1 m. Path loss can be calculated for any subsequent measurement taken at a distance d with received power Pr(d) using Equation 3.14 Combining (3.11) and (3.14) results in Equation 3.15 which allows n to be determined using the average path loss, Figure 3.5. Example Path Loss Results: Directional and Omni-Directional Antennas for LOS and NLOS Environments.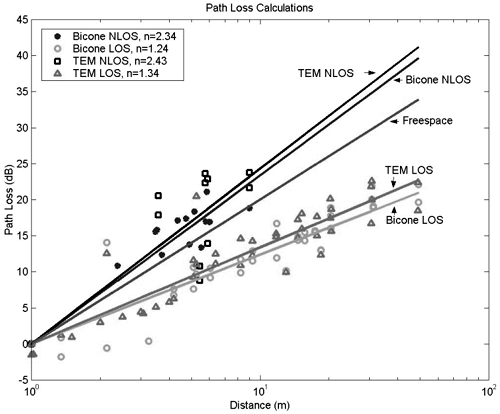 Note that (3.15) represents the average path loss experienced at a distance d relative to the distance do. The path loss observed at any given point will deviate from this average value due to variations in the environment. This variation has been shown to follow a log-normal distribution in many measurements [16, 26, 72]. Thus, the received signal power can be represented as Equation 3.16 where Xs is a log-normal random variable (that is, it is a zero mean Gaussian in dB) with standard deviation s As can be seen from (3.16), there are two main terms to determine from the environment: the path loss exponent and the standard deviation of the shadowing. There are two common approaches to obtaining these values. The first is to simply combine all measurements from similar environments (such as office NLOS) and determine the best fit to the data. This is the more common approach [5, 14, 25, 72]. A second approach is to determine the best fit for each specific building or room and create a statistical model for the path loss exponent and shadowing standard deviation. In this approach [17, 18], the two terms are modeled as Gaussian random variables. Thus, the path loss exponent is modeled as Equation 3.17 where mn is the mean of the path loss exponent, sn is the standard deviation, and X is a zero mean unit variance normal random variable. Similarly, the shadowing standard deviation is modeled as a Gaussian random variable. Note that in both cases the Gaussian distribution should be truncated to guarantee physically reasonable values. 3.3.3. Frequency Dependent ModelsWhile it was previously shown that path loss is not frequency-dependent for free-space and, to a large extent, LOS scenarios, this is not necessarily true for NLOS scenarios. The NLOS environment provides the opportunity for substantial pulse interaction, possible frequency selectivity, and the introduction of frequency dependence into the channel. Note that if we consider the frequency domain transfer function of a single channel realization, we will clearly observe frequency-selective behavior. However, in large-scale modeling, we are concerned with the ensemble average of transfer functions in a particular environment at various distances. If the average transfer function shows frequency dependence, apart from antenna effects, we must accommodate this in the model. In other words, we can model the frequency-dependent path loss as [77] Equation 3.18 where Again, there is no current consensus on this effect. While the measurements cited previously did not exhibit frequency dependence, other measurements have shown some frequency dependence in path loss. Specifically, the frequency-dependent decay of channel gain with increasing frequency is discussed in [51]. It was demonstrated from the measurements that the UWB channel shows, apart from a frequency selective fading pattern, a general decaying trend with increasing frequency. It is also shown that for the NLOS case, the decay is slightly steeper at higher frequencies than the LOS case. Specifically, the path loss at a given distance increases exponentially with frequency. The transfer function is given as Equation 3.19 or equivalently the path loss varies as Equation 3.20 where 0.8 Equation 3.21 where d is between 1 for LOS environments and 1.36 for NLOS environments with significant blockage of the path. Equivalently Equation 3.22 Finally, it should be reiterated that if the antenna effects are included in "path loss," there will certainly be frequency-dependent effects, especially if constant gain antennas are used. 3.3.4. Partition Dependent ApproachesThe information on the electromagnetic properties of building materials in the UWB frequency range provides valuable insights into assessing the capabilities and limitations of UWB technology. Reference [62] exhaustively examines propagation through 10 typical construction materials and their characterization for the frequency range of 0.5-15 GHz. Reference [60] discusses experimental results for the frequency dependent refractive index of dispersive materials between 5 and 85 GHz. Material-dependent attenuation can be incorporated into a path loss model to potentially provide more accurate path loss modeling. For example, [61] discusses basic partition-based path loss models for the narrowband indoor LOS and NLOS cases at 5.85 GHz. The model assumes a path loss exponent of n = 2, but includes losses for each partition through which the signal passes. The result is a model that provides a smaller standard deviation. A similar approach was suggested in [63] for UWB. Specifically, the path loss is modeled as Equation 3.23 where Lw is a building loss due to partitions, l is wavelength at the center frequency, and u (x) is a unit step function. A value of 0.7 dB/m is given for Lw [63]. Unfortunately, the model is not extensively tested with measurements. While this approach may offer improved accuracy as compared to standard path loss exponent models, it has yet to gain much attention in the UWB community, possibly due to the fact that UWB is currently envisioned only for short-range communications. Also, it requires partition information for specific rooms, which makes the model more site-specific. 3.3.5. Large-Scale Modeling StudiesMany studies characterizing indoor path loss and shadowing experienced by UWB signals have now been done. The two environments most heavily studied are the indoor residential environment and the office environment. The models developed have primarily used the frequency-independent approach given in (3.11) and (3.16). Notable exceptions are the studies listed in Section 3.3.3. Table 3.1 summarizes the measurements reported in the literature. In general, it is found that LOS channels exhibit path loss exponents in the range 1-1.8, whereas NLOS channels exhibit path loss exponents in the range of 2-4.1. Specifically, in [16], [17], and [18] the traditional exponential path loss model was applied to UWB signals, and path loss results for a residential environment were reported for the LOS and NLOS scenarios. These measurements used a vector network analyzer (VNA) and examined the frequency range from 4.375-5.625 GHz. In [30] the residential setting was investigated, and large- and small-scale LOS and NLOS results were reported for 2-8 GHz. Other campaigns investigated the indoor office environment. The measurements in [51] used a VNA to investigate the frequency range from of 1-11 GHz, with path loss and amplitude statistics being calculated for LOS and NLOS environments. Large-and small-scale findings using a time domain (pulse-based) measurement system with a center frequency of 2 GHz and a bandwidth of 1.5 GHz were reported in [55]. Large- and small-scale results using a time domain measurement system were also reported in [9, 10]. The work in [5], [6], [7], [62], and [72] is based on both time domain and, to a lesser extent, frequency domain measurements taken as part of the DARPA NETEX project. There are many other existing measurement results including [8], [20], [21], [22], and [24] that present path loss exponents and shadowing variances.
3.3.6. Antenna Impact on Large-Scale ModelingIdeally, we would like to establish channel models that are entirely independent of the antennas and the receiver structure. That is, the channel model should reflect only the impact of the channel. However, this is extremely difficult to obtain because it requires the antenna effects to be completely removed from the received data. This can be accomplished to some degree by defining path loss as the power loss with respect to a reference measurement as opposed to transmit power. However, full independence requires knowledge of the antenna impact on the received signal at all azimuthal and elevation angles and knowledge of the three-dimensional angle-of-arrival of each signal path. This is, in general, difficult to obtain. The concept of the "double-directional" channel is presented in [28], which attempts to eliminate all antenna effects. However, it requires spatial grid measurements at both the transmitter and receiver. To date, this approach has not been applied to UWB measurements [28]. Thus, nearly all empirically-based channel models will contain a degree of antenna dependence. However, it is reasonable that antennas with broadly similar characteristics will exhibit similar path loss. Perhaps the most important aspect of the antenna in this regard is its directionality. Because an omni-directional antenna collects more multipath energy than a directional antenna, it experiences lower "path loss" [5,74]. This is simply based on the fact that path loss is defined as the average power loss versus distance. However, we should understand that this is not a true channel characteristic as much as an antenna characteristic. This is a common theme in channel modeling for UWB. Care must always be taken when attributing observed behavior to the "channel." While we may reasonably model antenna effects as part of the channel, we must be cognizant of the antenna dependence of the models when applying them. As an example, consider the data plotted in Figure 3.5 [72]. This plot shows measured path loss values (relative to a free-space reference at 1 m) in an indoor environment when using two different antennas. Specifically, the measurements represent four scenarios using two antennas (bicone and TEM horns) and two measurement environments (LOS and NLOS). The resulting path loss exponents and "shadowing" standard deviation values are shown in Table 3.2. We can observe two trends. As one would expect, the path loss exponent for NLOS environments is larger than for LOS environments. This is expected due to the fact that as distance increases in NLOS environments, more objects may block the path between the transmitter and receiver, thus leading to a decrease in the average received power, which decays faster than free-space (that is, n > 2).
Secondly, we can observe that the path loss exponent experienced by TEM horn antennas is larger than by bicone antennas. Again, this is due to the fact that for the same transmit power the bicone antenna collects more multipath energy than the directional TEM horn antenna. It should be emphasized that these results [5,72,73] define path loss relative to a reference measurement, as opposed to transmit power. This eliminates the antenna gain from the path loss calculation. The result is interesting because it shows that in an indoor environment the additional gain due to directionality may be offset by larger "path loss," which is never the case in free-space. Note that similar results were presented in [29] for directional and omni-directional antennas. 3.3.7. Better than Free-Space PropagationOne item from Table 3.1 that may strike the reader as odd is that some LOS environments provide better path loss than free-space (that is, n < 2). However, this should be interpreted not as if the spreading loss associated with such channels is less than that observed in free-space. Rather, due to the additional power collected via reflections in indoor channels with an LOS path, the received signal power is greater than in free-space. The following analysis gives a specific example that demonstrates this effect [72,73]. Note that this phenomenon is not unique to UWB, but has also been demonstrated for narrowband channels (such as [26, 27]). Figure 3.6 shows an example UWB time domain measurement at a distance of 9 meters in an LOS scenario using TEM horn antennas. Note that in addition to the LOS path, there are reflections due to objects in the environment that are resolvable. Figure 3.6. Received Signal (Top) and Cumulative Received Energy (Bottom) for LOS Example using TEM Horn Antennas. (Right plots are enlarged views of the left plots.) [72, 73]SOURCE: B. Donlan and R. M. Buehrer, "The UWB Indoor Channel: Large and Small-Scale Modeling," submitted to IEEE Transactions on Wireless Communications [73]. © IEEE, 2004. Used by permission. 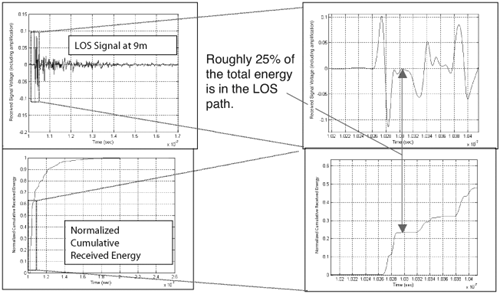 Figure 3.6 shows the received signal as well as the normalized cumulative received energy for two different time scales. The left figures show the entire received signal over approximately 70 ns, while the right figures show a close-up of 2 ns. The generated Gaussian pulse is shown in Figure 3.1, and TEM horn antennas are used. We can see that the LOS pulse of the received signal only accounts for about 25% of the total received energy of the signal. This by itself suggests that the path loss for this location would be better than free-space, but it is helpful to work out the exact path loss. The expected received power for free-space propagation, Equation 3.24 where P0 is a reference power taken at reference distance d0. Similarly, the measured received power, Equation 3.25 where a accounts for the deviation from free-space. The value of a and therefore the path loss exponent, n, can be determined by calculating the difference between the received powers given by (3.24) and (3.25), DPr, which is given as Equation 3.26 Substituting values from Figure 3.6 for Equation 3.27 Thus, the path loss exponent for this specific measurement, n = 1.5, is much better than free-space. Note that this represents only a single measurement. The true path loss exponent for an environment must be averaged over many such measurements. In environments that exhibit better than free-space propagation on average, several locations show similar behavior. However, we must reiterate that this does not mean that the signal actually propagates more efficiently; rather, the receiver simply collects more signal energy due to the waveguiding effect of the environment. 3.3.8. Receiver-Dependent Path Loss ModelsOne aspect that differentiates UWB systems from traditional narrowband and wideband systems is what is sometimes called energy capture. Specifically, in UWB systems, due to the high amount of time dispersion, capturing all the available energy is not always feasible. This will be discussed in more detail in the next section. The path loss that we have described to this point is sometimes called "total" path loss because it refers to the path loss observed by the total received signal [55, 72]. Depending on the receiver structure used, the total received signal energy may not be captured. As a result, it can be useful to define receiver-dependent path loss models. However, extreme care should be taken when defining such models, as they cannot be used with receiver structures that differ from those for which they are defined. One type of receiver-dependent path loss model is what is sometimes called "peak path loss" [55, 72]. The phrase "peak path loss" is somewhat of a misnomer, but signifies that only the peak multipath amplitude of the received signal is used to calculate the received signal power. This value is then compared to the free-space path loss at 1 m. Thus, it represents the path loss of the strongest multipath component. As with the "total" path loss, local area averaging is used to determine the path loss. This metric is helpful in conjunction with total path loss in order to obtain a clearer picture of the experienced path loss. This is particularly useful for UWB because many receivers may not be able to capture the large amount of diffuse signal energy. A receiver that captures only the most significant multipath component observes a much larger average path loss, which is represented by what is called "peak path loss." Table 3.2 gives the calculated total path loss parameters n and s fit to the same measurement data discussed in Figure 3.5 [72]. As a comparison, Table 3.3 presents path loss parameters using the same measurement data for the path loss of the strongest multipath component. Again, note that the path loss is relative to free space at a distance of 1 m. The LOS path loss based on this definition will always be 2 because it only considers the strongest path (that is, the LOS path). Note that the path loss is significantly greater than the total path loss given in Table 3.2. This is due to the fact that we specifically eliminate the multipath collecting effect and focus only on the strongest path between the transmitter and receiver. Again, this path loss model would be applicable only to receiver structures that capture only a single path. The link budget for such a receiver could use the "peak path loss" model to determine the received signal power. An alternative for such receiver structures would be to use the total path loss and simply incorporate an energy capture factor in the link budget to account for the receiver architecture. This is discussed in Section 3.3.10. A model that combines the total received energy (power), the power in the strongest component, and the rms delay spread is given in [35]. Specifically, the authors argue that the received power of the strongest component Ps (d) at distance d can be modeled as Equation 3.28
where P (d)is the total received power at distance d, to is the time resolution of the receiver, and trms is the rms delay spread. Further, the rms delay spread increases linearly with distance, leading to the approximate relationship Equation 3.29 where dt is a breakpoint distance of approximately 1 m. Further measurements in [35] demonstrate that Equation 3.30 and Equation 3.31 which validates the relationship in (3.29). 3.3.9. ShadowingReferring to (3.16), the term Xs, which accounts for the variation in the received signal power about its mean value, is typically termed "shadowing." This is usually modeled as a log-normal random variable with standard deviation s. Typical values are given in Tables 3.1 and 3.2. Figure 3.7[2] shows some example CDFs for the deviation of the measured received power from the calculated average for an indoor channel with bicone antennas in LOS and NLOS environments [72]. This deviation in general has been shown to fit a log-normal distribution fairly well [16-18, 26]. It should be noted that while this variation has traditionally been termed "shadowing," because it typically stems from variations in the large-scale structure of the environment, we must be careful when applying this term to indoor data sets. Specifically, in LOS environments, the variation in received signal power is not necessarily due to the shadowing of the receiver by large objects as much as variation in the mutipath profile. LOS channels with a significant amount of clutter around the transmitter or receiver may exhibit higher received signal power than simpler LOS channels. For example, hallways tend to result in strong multipath echoes that can be captured by the receiver, resulting in higher average signal power. Note that the standard deviation of the shadowing itself varies from environment to environment. Measurements have found this value to be between 1.5 dB and 4 dB (see Table 3.1). Like the path loss exponent, some researchers suggest modeling the shadowing parameter as a random variable. For example, [18] proposes modeling the standard deviation,s, as a truncated Gaussian random variable. Thus, the path loss at distance d is modeled as
Equation 3.32 where Figure 3.7. CDFs of the Difference Between the Average and Measured Received Power and Fit to a Log-Normal Distribution for Two Examples (Represents Shadowing).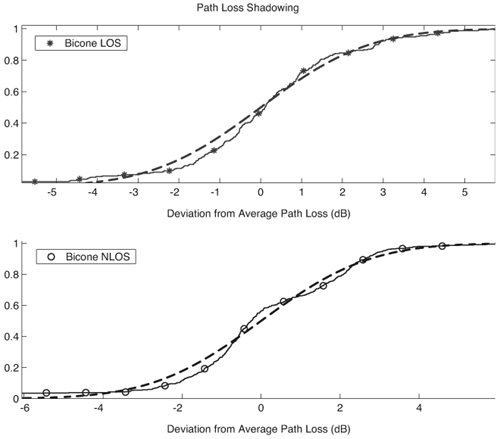 3.3.10. Link Budget CalculationsIn this last section dealing with large-scale channel modeling, we examine how it is used in the development of link budgets for UWB systems. Due to the extremely wide bandwidths involved, the UWB link budget can differ significantly from narrowband link budget relations. Thus, we will discuss these potential differences. However, before we discuss UWB links, let us first briefly review traditional link budget design assuming free-space propagation. We will relax the free-space restriction shortly. For the current discussion, the free-space model allows us to highlight the differences between traditional link budget design and UWB link budget design. The goal of a link budget is to determine the range of a system (that is, maximum distance between the transmitter and receiver) for a required reliability and power limitation. For a digital communication system, the reliability is typically specified as an Eb/No (that is, ratio of energy per bit to noise power spectral density) requirement for some distance or percentage of the coverage area. Thus, a standard link budget can be written as shown in Table 3.4. The received signal power in dBm is equal to the transmit power in dBm plus the gains of the transmit and receive antennas (in dBi or dB relative to an isotropic antenna) minus the path loss (again in dB). As noted previously, what is traditionally termed the path loss
UWB Link BudgetIt is natural to apply the preceding analysis to UWB systems. However, there are several problems with this approach (specifically for I-UWB systems):
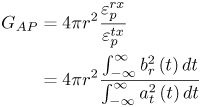
One proposed method to accommodate these differences is to make three basic changes to the traditional link budget approach [78]. First, the transmit and receive antenna gains are removed from the budget. Second, the impact of the effective aperture of the antenna is removed from the path loss. Instead, the antenna gains and effective apertures are replaced with a single term labeled the "antenna-pulse coupling gain" or GAP. This term captures the gain in either energy or peak power in the received pulse with respect to the generated pulse. Whether energy or power is examined depends on the modulation scheme used, and we will discuss this shortly. In some cases the two measures may be equal, but not in general. It should be clear that this gain is very different from the traditional antenna gain. It is different because it defines an antenna pair as opposed to a single antenna, and because it is pulse specific. Just as the traditional "gain" of an antenna is frequency specific, GAP is pulse specific. Additionally, it captures the receive antenna aperture which is normally lumped into path loss. As a result, the "gain" actually has a negative dB value in general and has units of square meters (m2). The second modification to the traditional link budget is that path loss now accounts only for spreading loss, not effective aperture at the receive antenna. This is consistent with the path loss modeling discussed earlier. Thus, we can define path loss as Equation 3.33 where r is the distance between the transmitter and receiver. This simply represents the power distributed over the area of a sphere of radius r; thus, it has units of square meters (m 2). A third difference in the I-UWB link budget is that it should be in terms of either pulse energy or peak pulse power. In traditional link budgets, we deal with average power. However, average power may not be useful in UWB because low duty cycle pulses are possible. Also, we are interested in the impact of the antenna on the pulse, not just the impact on average power. Because both the pulse shape as well as peak power could be affected, we allow for GAP to be defined either in terms of peak pulse power or pulse energy. The former would be more applicable to threshold detector receivers, while the latter would be more applicable to correlator receivers. The resulting link budget is given in Table 3.5. The term GAP can either be determined directly from a time domain line-of-sight measurement or derived from an antenna s21 measurement. Specifically, for a pulse energy-based link budget, the gain should be determined as Equation 3.34 where ep represents the pulse energy, at(t) is the generated pulse, and br(t) is the received pulse measured at a distance r m in free-space or calculated as (see Chapter 4) Equation 3.35 where the combined response of htx(t) and hrx(t) can be determined for the antenna pair of interest from an s21 measurement and
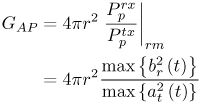
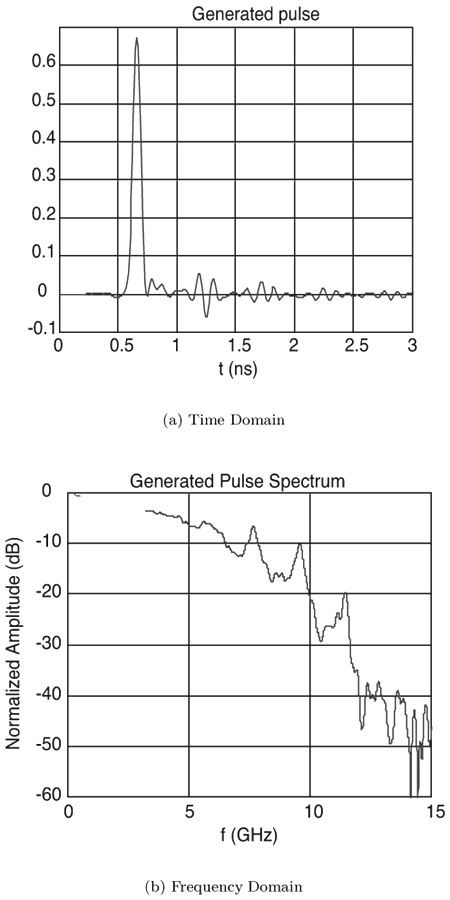
Thus, GAP represents the energy gain of the pulse due to the antennas. Note that this term is not waveform independent. That is, it is not merely a factor of the antenna, unlike the traditional antenna gain. It is waveform specific. As such, care must be taken in its use. The received pulse energy in dBmJ (that is, dB relative to one mJ) is then calculated as Equation 3.36 The noise power spectral density No is calculated as before, and Ep/No dB is simply Er (dB) No (dB). Of course, this is the energy per pulse, not necessarily per bit. In many systems multiple pulses may be transmitted per bit. Thus, this value must be multiplied by the number of pulses per bit Ns (added in dB) to obtain the energy per bit. The result then represents the available Eb/No or the SNR of a matched filter output. Due to pulse mismatch, which is much more likely in UWB due to both the channel and limitations in replicating the received pulse, we must add a factor r (negative in dB or less than unity in linear), which represents the fraction of the energy captured by the receiver. This factor can either be due to per path distortion or overall temporal dispersion of the channel. For example, consider a RAKE receiver that uses only two to three correlators. Based on the discussion in Section 3.4.8, we know that in many environments, such a receiver only captures ~ 20% of the total energy. Thus, a factor of r = 0.2 (7dB) should be included in this case, provided the path loss value implies total energy capture. Various receiver structures will have different values of r. The final result is the Eb/No available to the detector. Receiver Structure DependenceThis development has been specifically in terms of energy because we are typically interested in the received energy per bit. Traditional link budgets can obtain Eb from the average received power as Eb =PrTb. However, this is not necessarily true for UWB; thus, we have set up the budget in terms of the energy per pulse. If the receiver is based on threshold detection or is otherwise concerned only with the peak power of the pulse, the link budget should be worked in terms of peak power. In that case, we should define the pulse antenna coupling gain as Equation 3.37 where again br (t) is the received signal at a distance of r meters, As a final note, we should mention that the preceding analysis is more applicable to pulse-based I-UWB rather than to MC-UWB. With MC-UWB, we can resort to traditional narrowband approaches for each carrier. Link Budgets for Systems Other than Free-SpaceThe analysis in the previous section considered only free-space propagation. For non-free-space environments, as discussed in Section 3.3.2, a traditional approach is to model the average received power using a log-distance power decay law. That is, we can represent the average received pulse energy at a distance r as Equation 3.38 where e0 is the pulse energy received at a reference distance assuming free-space. This is the traditional log-distance path loss model [26] that was discussed in Section 3.3.2. Note that the average is a spatial average. If we define our reference distance as 1 m (typical for indoors), we would redefine total path loss as Equation 3.39 where n is the path loss exponent defined as the path loss relative to a 1 m free-space measurement. This reference distance should be the same used to calculate GAP.Finally, we must include a fade margin in non-free-space environments as discussed previously. ValidationA validation of this approach was performed as part of a UWB measurement and modeling project through DARPA's NETEX program [72,78]. Specifically, measurements were taken at various distances to compare the results with predictions from the link budget approach. Specifically, the received pulse energy and the peak power of the received pulse were examined and compared to what was predicted. The antennas used at both the transmitter and receiver were wideband bicone antennas. GAP was determined from two separate experiments. First, the s21 parameter of the link between the two antennas was measured. This measurement was used to determine the combined antenna frequency response Equation 3.40 Using this combined frequency response, Br(w) was determined from At(w), the generated pulse plotted in Figure 3.8. Using the time domain versions of the generated and predicted received pulse, GAP was determined from (3.34). Next, GAP was determined from time domain measurements at 1 m, where the LOS pulse was time gated from the received signal. The resulting values of GAP from the two approaches are listed in Table 3.6 [78]. Note that two distinct time domain measurements were used to create two estimates using the time domain approach and are listed as values (a) and (b) in the table. Note that the value is a large negative value (in dBm2). This is to be expected because it captures the effective receive aperture. All the values are within 1.4 dB. Figure 3.8. Generated Pulse.
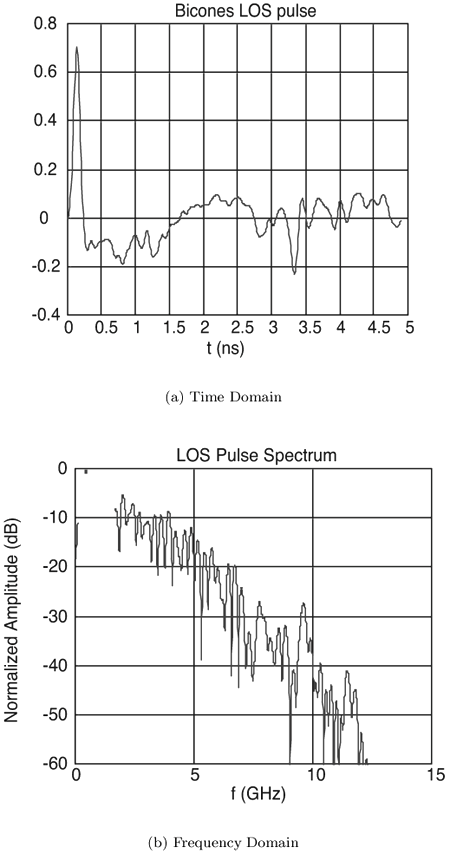
Using the measured values of GAP =27.4 dB and GAP =26.0 dB, the predicted received pulse energy was compared to the measured pulse energy at several distances and is given in ble 3.7 [78]. The measured and predicted values match very closely, with the measured and predicted values coming within 1 dB of each other in all cases. As previously mentioned, the energy gain in the pulse is not necessarily the best metric for every modulation scheme or receiver structure. Thus, we are also interested in the peak power gain in the pulse as defined in (3.37). This metric was measured for a pair of bicone and TEM horn antennas using the pulse given in Figure 3.8. The received pulses are given in Figures 3.9 and 3.10 and the results are presented in Table 3.8 [78]. We can see that the values are similar for the bicone antennas (that is, peak gain is similar to energy gain). However, for the TEM horn antenna, the energy gain is approximately 3 dB higher than the peak power gain. Additionally, the energy gain of the TEM horn is 3 dB higher than the bicone. This is reflective of the fact that the TEM horn is a directive antenna. Thus, the energy gain is greater than the bicone. However, because the pulse shape is substantially changed (compare Figure 3.10 with Figure 3.8), the peak power gain is less (that is, a single peak has been transformed into two peaks). Figure 3.9. Received Pulse Using Bicone Antennas. Figure 3.10. Received Pulse Using TEM Horn Antennas.
| ||||||||||||||||||||||||||||||||||||||||||||||||||||||||||||||||||||||||||||||||||||||||||||||||||||||||||||||||||||||||||||||||||||||||||||||||||||||||||||||||||||||||||||||||||||||||||||||||||||||||||||||||||||||||||||||||||||||||||||||||||||||||||||||||||||||||||
|
EAN: 2147483647
Pages: 110


