Section 7.1. Debugging
7.1. DebuggingIn general, the process of debugging can be boiled down to making the right information visible. All debugging tools attempt to do thatthrough, for example, logfiles, inspectors, and breakpointsthey all help you to break down a complex interaction into smaller chunks so that you can rule out certain causes, and narrow in on the correct ones. Let's look at a few different debugging tools: the Rails exception screen, logging, the console, and inspectors. 7.1.1. Understanding Rails ExceptionsWhen running in the development environment, any Rails action that results in an error or an exception will result in an exception debugging screen, as in Figure 7-1. Figure 7-1. Typical Rails exception screen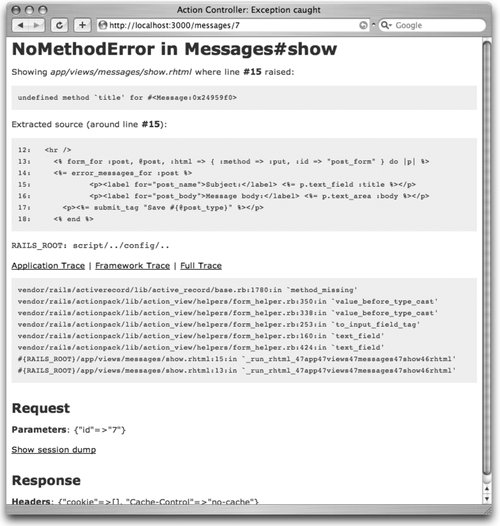 Anyone doing a significant amount of Rails development will become very familiar with messages like this, so it's worthwhile to take a look at what it says. The first few pieces are the most important. The header tells you the name of the exception that was thrown and the name of the action (e.g., ControllerName # ActionName) where it occurred. If the exception descended from code in a view file (as in this example), Rails will tell you exactly which file and which line is causing problems, and even display a snippet of the source code around the offending line. Usually, the combination of the exception message and the source extraction will quickly lead you to the mistake. In this case, the exception message (undefined method 'title' for #<Message:24959f0>) provides a clue that we're calling a title method on some instance of the Message class, but that the object doesn't support the method. Looking at the extracted source code, the only mention of title is an argument to the text_field helper. So why the error? The most probable cause is that I mistyped the name of the model attribute. A quick check against the schema (not shown in Figure 7-1) confirms the suspicion: the actual column is called name. In some cases, the problem won't be so apparent. The excerpted code only shows where the exception originated at the view level, but that doesn't necessarily mean the view code is wrong. If the view calls a method from a helper or a model, the error might be there. It's time to dive into the stack trace. The top line of the stack shows which line of code threw the exception. The next line shows the next step down the stack: the line of code that called the offending method. And on and on, tracing the calls all the way down the stack, usually ending with dispatcher.rb, the entry point for Rails requests. When examining particularly hairy bugs, examining the stack trace can provide insight into where the request is going wrong. Learning to read the stack trace is an art that takes some experience, but the Rails exception screen makes it more approachable by providing three different views of the data: the application trace, the framework trace, and the full trace. The application trace only shows the parts of the stack that are in your code, cutting out all of the Rails framework, which is less likely to be the source of the bug. The framework trace is the opposite, showing just the Rails files. And the full trace shows the whole thing, top to bottom. Nine times out of 10, the top line of the application trace will direct you to the source of the bug, but if not, studying the application trace can give helpful context, allowing you to check your assumptions about the flow of logic through the application. 7.1.2. Using the Development LogEvery programmer has done it: when you are trying to debug a chunk of code and need to see the value of some expression, you simply add a print command inline with the rest of the code, run it again, and look at the output. Lather, rinse, repeat. It may feel vaguely dirty, but it gets the job done. The problem is that it's brittle. At one time or another, every programmer has also forgotten to remove the debugging line from the code before it shipped. Moreover, it's a bit wasteful: you spend time creating debugging statements once, and then delete them before going into production...only to add them back the next time a problem surfaces. The print statement (or puts, as is more common in Ruby) is the blunt instrument of debugging. It doesn't scale. As your development gets more complex, a more refined tool is called for, and that tool is a logger. By using an application-wide logger, your debugging messages are rationalized and decoupled from the normal application flow, meaning there's no danger of accidentally leaving debugging messages in a production application. The most basicand essentialdebugging tool is a Rails application's logfiles, which record details about every request received by the application. Stored in each project's log directory, there is one logfile for each environment: development, production, and test. Each environment can have different log levels, so for example, production.log won't generally show quite as much detail as development.log. If you are running your Rails application via script/server, the development logfile will automatically be printed to the console. Otherwise, the tail utility (standard on Unix-like systems, including OS X but also available in Windows from http://tailforwin32.sourceforge.net) is handy for monitoring the logfiles. Just run tail f log/development.log to get a running monitor of the latest log entries. Here's what a typical logfile looks like: Processing ArticlesController#edit (for 127.0.0.1 at 2006-07-04 23:22:42) [GET] Session ID: ab095483400d6b99f4c7b61d4b7dc70c Parameters: {"action"=>"edit", "id"=>"1", "controller"=>"articles"} Article Columns (0.001233) SHOW FIELDS FROM articles Article Load (0.001884) SELECT * FROM articles WHERE (articles.id = 1) LIMIT 1 Rendering within layouts/articles Rendering articles/edit Completed in 0.06104 (16 reqs/sec) | Rendering: 0.03784 (61%) | DB: 0.00312 (5%) | 200 OK [http://localhost/articles/1;edit] Processing ArticlesController#update (for 127.0.0.1 at 2006-07-04 23:23:03) [PUT] Session ID: ab095483400d6b99f4c7b61d4b7dc70c Parameters: {"article"=>{"title"=>"Using logfiles", "body"=>"The logfiles are invaluable."}, "commit"=>"Save", "_method"=>"put", "action"=>"update", "id"=>"1", "controller"=>"articles"} Article Columns (0.001387) SHOW FIELDS FROM articles Article Load (0.001925) SELECT * FROM articles WHERE (articles.id = 1) LIMIT 1 SQL (0.000751) BEGIN Article Update (0.027114) UPDATE articles SET 'title' = 'Using logfiles', 'body' = 'The logfiles are invaluable.', 'user_id' = 1 WHERE id = 1 SQL (0.001924) COMMIT Redirected to http://localhost:3000/articles/1 Completed in 0.08334 (11 reqs/sec) | DB: 0.03310 (39%) | 302 Found [http://localhost/articles/1]Take a look at all of the information available here: for each request, the first line shows which controller and action have been dispatched, with which HTTP method. Next, the session ID is noteduseful for debugging session and cookie-related problems. Then the request parameters are logged, not in query-string or form-encoded format, but as they are parsed by Rails, which is also useful for verifying that Rails is receiving the input that you expect it to. Next, all of the action's SQL statements are logged, and finally the action's response (either a render or a redirect, along with an HTTP status code). Rails uses Ruby's standard logging tool. It's available (as logger) to use from within your Rails application from anywhere, including models, mailers, controllers, views, tests, and the console. For example, accessing the logger from a model looks like this: class Message < ActiveRecord::Base def after_initialize logger.info "This is the model" end end To write to the logfile from a controller action, the usage is the same: def show logger.info "This is the controller" @post = Message.find params[:id] end To write to the logfile from the view, just include a call to logger in an RHTML template: <% logger.info "This is the view" %> The resulting entry in development.log would show all three messages: Processing MessagesController#show [GET] Parameters: {"action"=>"show", "id"=>"1", "controller"=>"messages"} This is the controller Message Columns (0.002579) SHOW FIELDS FROM messages Message Load (0.001082) SELECT * FROM messages WHERE (id = 1) LIMIT 1 This is the model Rendering within layouts/application Rendering messages/show This is the view Completed in 0.10790 (9 reqs/sec) | 200 OK [http://localhost/messages/1]To access the logger from the console or your tests, use the constant RAILS_DEFAULT_LOGGER. 7.1.3. Interactive Consoles7.1.3.1. Using IrbPerhaps the most essential tool in the toolbox of the Rails developer is the interactive shell, or console. Using Ruby's standard Interactive Ruby (Irb) library, the console allows you to access every part of your application from the command line. You can load ActiveRecord objects, inspect and edit data, and save the changes back to the database. You can simulate controller requests and inspect the resultnot just the raw HTML response, but the template assignments, session state, flashes, and more. If you are new to Irb, let's give it a quick spin. From your command prompt, run irb and you'll get a prompt like this: irb(main):001:0> Now enter in any Ruby snippet (say, 123 + 456), hit Enter, and Irb will print the output: irb(main):001:0> 123 + 456 => 579 Remember that in Ruby, everythingeven integersare objects with methods. Every object has a method called class, which will tell you what type of object you have: irb(main):002:0> 123.class => Fixnum Another universally available method is methods, which returns an array of every method defined for the object: irb(main):003:0> 123.methods => ["method", "%", "between?", "send", "<<", "prec", "modulo", "&", "object_id", ">>", "zero?", "size", "singleton_methods", "__send_ _", "equal?", "taint", "id2name", "*", "next", "frozen?", "instance_variable_get", "+", "kind_of?", "step", "to_a", "instance_eval", "-", "remainder", "prec_i", "nonzero?", "/", "type", "protected_methods", "extend", "floor", "to_sym", "|", "eql?", "display", "quo", "instance_variable_set", "~", "hash", "is_a?", "downto", "to_s", "prec_f", "abs", "singleton_method_added", "class", "tainted?", "coerce", "private_methods", "^", "ceil", "untaint", "+@", "upto", "-@", "div", "id", "**", "times", "to_i", "<", "inspect", "<=>", "==", ">", "===", "succ", "clone", "public_methods", "round", ">=", "respond_to?", "<=", "freeze", "divmod", "chr", "to_f", "__id_ _", "integer?", "=~", "methods", "nil?", "dup", "to_int", "instance_variables", "[]", "instance_of?", "truncate"] What's going on in these examples? Regular numbers (like the integer 123) aren't normally thought of as objects, but in Ruby they are. This is an example of introspection: Ruby's ability to look inside itself (e.g., asking an object what its class is or what methods it supports). Looking at this array of methods, you might notice one called next, and wonder what it does. Just try it out: irb(main):004:0> 123.next => 124 It turns out to be very simple: it just adds one to the value. Introspection is a hugely valuable tool for exploring and learning about Ruby and Rails objects. Just by looking at the available methods and trying them out, you can learn a great deal. 7.1.3.2. Using the Rails console with ActiveRecordNow let's quit Irb (enter quit) and switch to the Rails console, which is really just a wrapper around Irb, specialized to automatically include your application's entire environment. The console can be used to drive your application on different levelseither directly with domain objects (i.e., ActiveRecord objects, or models), or by simulating requests to controllers. To get a feel for working with models, suppose you have a simple database structure consisting of articles and users, with a one-to-many relationship. The corresponding models have basic associations and validations: class Article < ActiveRecord::Base belongs_to :user validates_presence_of :title end class User < ActiveRecord::Base has_many :articles validates_presence_of :name end With that structure in place, the Rails console provides a rich environment for interacting with the domain model. To try it out, run script/console, and explore a little: $ script/console Loading development environment. >> a = Article.new => #<Article:0x22409e8 @attributes={"user"=>nil, "title"=>nil, "body"=>nil}, @new_record=true> >> a.name = "Using script/console" => "Using script/console" >> a.save => true >> User.create :name => "Scott" => #<User:0x22289c4 @attributes={"name"=>"Scott", "id"=>1}> >> u=User.find :first => #<User:0x223587c @attributes={"name"=>"Scott", "id"=>"1"}> >> a.update_attributes :user_id => u.id => true >> u.articles => [#<Article:0x222bc64 @attributes={"body"=>nil, "title"=> "Using script/console", "id"=>"1", "user_id"=>"1"}>] >> u.articles.create => #<Article:0x2223758 @attributes={"body"=>nil, "title"=>nil, "user_id"=>1}, @errors=#<ActiveRecord::Errors:0x2222efc, @errors={ "title"=>["can't be blank"]}>>Take a look at all that's happening here. First, we instantiate a new, unsaved ActiveRecord object. That record is assigned to the variable a, and a representation of it is printed to the terminal (#<...> is Ruby's standard way of representing objects textually). Because ActiveRecord automatically creates getter and setter methods for every database column, you can easily change the object's attributes (a.title='...'), and then save the record to the database (a.save). The next line illustrates the same process, condensed to just one line, using the create method. Then, using update_attributes, we create an association between the two records, and access the user's articles association, which returns an array of Article objects. Finally, we attempt to create a new article, but aren't successful, because of a validation error, which is visible from the console output. As you can see, the full ActiveRecord API is available from within the Rails console, making it an invaluable debugging tool for model-related issues. 7.1.3.3. Using the Rails console with ActionPackThe console isn't limited to interacting with your models; it can interact with your controllers as well. The key is the app object, which is an instance of ActionController's Integration Session class. An Integration Session acts like a virtual user of your web applicationone with state (like cookies), so that you can perform a series of requests. The app object that's available in the console has a method for each major HTTP verb (get, post, put, and delete). The first argument is the URL path to request, the second is a hash of parameters for the request, and the third is a hash of headers. Take a look at this example of using an integration session: script/console Loading development environment. >> app.get '' => 200 >> app.response.body[0..150] => "<!DOCTYPE html PUBLIC \"-//W3C//DTD XHTML 1.0 Transitional//EN\" \"http://www.w3.org/TR/xhtml1/DTD/xhtml1-transitional.dtd\">\n\n<html xmlns=\"http://www.w3.org/1999/xhtml\" xml:lan " The first line sends an HTTP GET request to the root URLpresumably the site's home page. The result of the call is the HTTP response status code 200, indicating a successful response. The next line requests the first 150 characters of the response body. So far, so good! Now let's try faking a form submission: >> app.post "/signin", :person => { :login => 'scott', :password => 'secret' } => 302Here we send an HTTP POST to the /signin pathwhich in this case, is hooked up to an action that authenticates a user and stores that user in the session. The result this time is the HTTP status code 302, indicating a redirect. Just what we'd expect for a successful login. Don't forget that you can mix ActiveRecord calls with Integration Session calls: >> Person.count => 1 >> app.post "/people", :person => { :name => "David Jones", :email => "dj@example.com" } => 302 >> Person.count => 2In this example we're doing a little bit of sanity-checking. First we use ActiveRecord to see how many Person records are currently in the database, and then we simulate a POST to the /people URL, including a set of parameters, as though we submitted a form. And in case the resulting 302 status code (a redirect) isn't enough evidence that things worked, we double-check that Person.count is returning the new expected value. So far we've been hand-writing the paths for the requests (e.g., "/people" in the example above), but we could also use the familiar url_for helper and named routes to generate URLs. For example: >> app.person_url :id => 1 => "http://www.example.com/people/1" >> app.delete app.person_url(:id => Person.find(:first)) => 302 >> Person.count => 1 In this case, we see an example of accessing named routes from the console, in order to verify that they are behaving as expected. And finally, an example of the HTTP DELETE method and another check to make sure it truly worked. Integration Sessions and the app object were added to Rails to support integration testing, which is discussed in detail later in this chapter. 7.1.3.4. Rails breakpointsBreakpoints are an invaluable debugging aid, allowing you to essentially pause execution mid-action, inspect and even modify variables in situ, and then resume execution. Pure debugging gold. Let's take a look at how to use breakpoints. Suppose we're developing an application with a message resource and working on the template for the show action. Reloading the page in the browser, we get a Rails exception message: NoMethodError in Messages#show undefined method 'title' for #<Message:0x4fd16c8> Not sure why the action is failing, we decide to use breakpoints to explore the problem. Switching to the controller, we add the breakpoint command to the action: def show @post = Message.find params[:id] breakpoint end Save it, switch back to the browser, and refresh. The browser will start to reload the page but won't ever finish. When Rails encounters the breakpoint statement, it suspends execution and allows you to enter a console session in the midst of the action. To enter the breakpoint, use the script/breakpointer command, just like the script/console command. The result looks like this: $ script/breakpointer Executing break point at script/../config/../app/controllers/messages_controller.rb:20 in 'show' irb(#<MessagesController:0x4f2d0f0>):001:0> Notice that the prompt informs you which breakpoint you are in. The instance_variables method returns an array of instance variables available in the current context: irb(#<MessagesController:0x2485730>):004:0> instance_variables => ["@post", "@headers", "@performed_redirect", "@flash", "@request", "@_ _bp_file", "@assigns", "@action_name", "@params", "@current_user", "@session", "@template", "@cookies", "@_ _bp_line", "@request_origin", "@performed_render", "@variables_added", "@response", "@url", "@before_filter_chain_aborted"] Of course, you can also access any methods that are available in the controller, such as params: irb(#<MessagesController:0x4f2d0f0>):001:0> params => {"action"=>"show", "id"=>"7", "controller"=>"messages"}Because the breakpoint was called after the @post instance variable was set by the action, you can inspect its contents: irb(#<MessagesController:0x4f2d0f0>):002:0> @post => #<Message:0x4f0bcc0 @attributes={"name"=>"Untitled Message", "body"=>"", "id"=>"7", "created_at"=>"2006-07-06 21:02:48"}>And, narrowing in on the problem at hand, you might ask for a list of just the model's attributes: irb(#<MessagesController:0x4f2d0f0>):003:0> @post.attributes.keys => ["name", "body", "id", "created_at"] Breakpoints can be added to views as well: just add <% breakpoint %> somewhere in a template file. When you're finished examiningor even modifyingthe state of the application, enter exit to close the breakpointer session. The action will pick up where it left off and send a response to the browser. 7.1.4. InspectorsThe essential goal of debugging is visibility: seeing the hidden properties of objects in the system. So far we've looked at two means of gaining visibility into the system, logging and the console. Here we'll look at a third class of tools, inspectors. Some inspectors are built into Rails itself, some are third-party Rails plug-ins, and others are client-side browser add-ons. All have a place in the Rails developer's toolbox. 7.1.4.1. Using the debug helperThe debug helper available in your Rails templates is incredibly simple: pass it any object, and it will convert the object to YAML (Yet Another Markup Language) format, wrapped in <pre> tags. In other words, it's a glorified print statement. It may not be clean, but in the early stages of development, it gives a handy look into what attributes an object has available and what their values are. Figure 7-2 shows an example of a Message object's attributes and values. Figure 7-2. Using the debug helper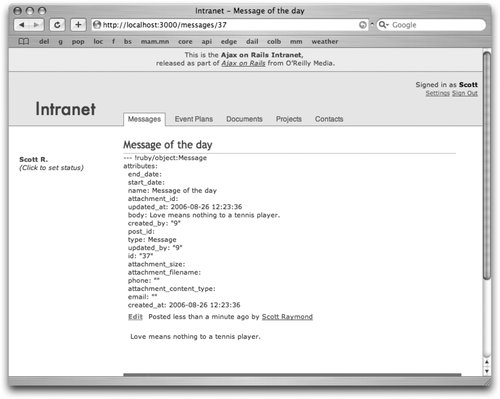 The debug helper can be particularly powerful when working on a Rails application with a team of people. For example, suppose your team includes a frontend developer who is responsible for the view layer: markup, JavaScript, CSS, etc. While he's a pro at the client-side technologies, Rails isn't his forte, and tools like the console might be intimidating. On the other hand, the back-end developer is most comfortable (and productive) working with databases, ActiveRecord, associations, etc.but not-so-skilled in UI design and browser idiosyncrasies. The debug helper provides a great bridge. Imagine a two-stage development process. First, the back-end developers can build the database structure, create the models, and sketch in rough controllers to define instance variables for each action. For the view, they simply create one debug statement for every instance variable assigned to the view. Then it's tossed over the wall to the frontend developer, who can clearly see what information is available in the view, without having to reference the database schema or the other layers of the Rails architecture. 7.1.4.2. RJS debugging modeRJS (explained in Chapter 5) is the secret ingredient that makes Ajax in Rails so powerful and easy. But there is an Achilles' heel: RJS can be frustrating to debug. The reason is simple. When you navigate to a normal HTML page and something goes wrong on the server, Rails returns an exception screen full of details about what went wrong and how to find it. But with RJS, the expected result isn't HTMLit's JavaScript for the browser to evaluate. If there's a bug in the generated JavaScript, the browser will simply fail to execute it, and you won't have access to the source. The solution is RJS debugging mode. It's on by default in the development environment; to manually turn it on or off, use this line in config/environments/development.rb (or production.rb, as needed): config.action_view.debug_rjs = true When on, any JavaScript generated by RJS templates will be automatically wrapped in a TRy/catch blockso if an exception occurs while it's being evaluated, you'll be notified with two alert boxes. The first simply provides the exception message. The second is the most important: the full source of the JavaScript being evaluated. Often, that information is more than sufficient to spot and eliminate the bug. Keep in mind, however: RJS debugging mode works when there is an error in the JavaScript executionnot when there is a Rails exception in the action or the RJS code. For those problems, the development log is the best place to turn. 7.1.4.3. Routing NavigatorAs a Rails application increases in scope and complexity, it will often outgrow the default route (:controller/:action/:id) and require custom routes. In fact, even if you are using the standard route layout, custom routes are still useful so that you can give names to them. And when using map.resource to create routes, the list can quickly get very large. Soon, working with (let alone remembering) all the possible permutations can get difficultand error-prone. Routing Navigator eases the pain. It's a plug-in that adds a powerful set of utilities to your applicationright in the browserto help explore your routes. Best of all, it is automatically disabled in the production environment, so you can safely leave it installed, confident that your users will never see it by mistake. To install it, run this command from the root directory of your Rails project: script/plugin install \ http://svn.techno-weenie.net/projects/plugins/routing_navigator Then add these two lines to your application's layout file(s), to include the necessary JavaScript and CSS files (which should have been automatically copied to the public directory during installation): <%= javascript_include_tag 'routing_navigator' %> <%= stylesheet_link_tag 'routing_navigator' %> Once done, you'll see a row of links added to the bottom of every page of your application in development mode, as seen in Figure 7-3. Each link provides a different view of your routes. For example, "Named Routes" details the named routes defined for the current controller, along with their requirements and conditions, as seen in Figure 7-4. Figure 7-3. Using the Routing Navigator plug-in Figure 7-4. The Routing Navigator expanded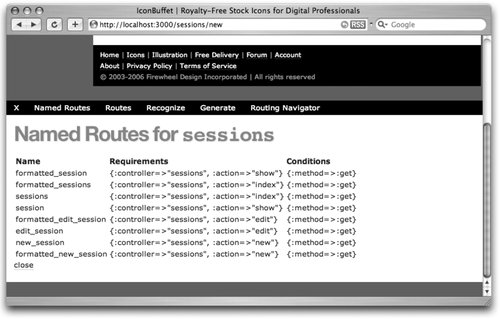 7.1.4.4. FireBugFireBug is an extension for the Firefox browser that is fantastically useful for Ajax development. Many of the best debugging tools and techniques provided by Rails on the server side are provided by FireBug on the client side, including a JavaScript logger, a JavaScript console, and JavaScript breakpoints. Installation and full documentation are available from the FireBug web site at http://joehewitt.com/software/firebug. The first major feature of FireBug is its interactive DOM inspector, shown in Figure 7-5, which allows you to simply point at an element on a web page and instantly see the corresponding HTML source code. The source is displayed in an expandable tree view, which makes navigating to the right part of the page a snap. The source tree isn't merely a static view: it's editable. Double-click any element attribute (e.g., an inline CSS style) to edit it, and the results will be reflected in the page immediately. There are few faster ways to try out CSS changes. Figure 7-5. FireBug's DOM inspector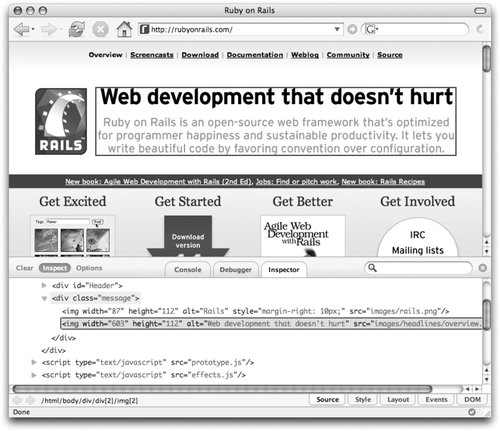 FireBug can also give visibility to Ajax calls. Figure 7-6 shows this in action. In this case, the user had just clicked an "add to cart" link, which triggered a Rails RJS template to update three parts of the page. By clicking the Console tab and selecting Show XMLHttpRequests from the Options menu, FireBug will display the full details for every Ajax callincluding HTTP method, URL, request body, response body, and response headers. Figure 7-6. FireBug's Ajax inspector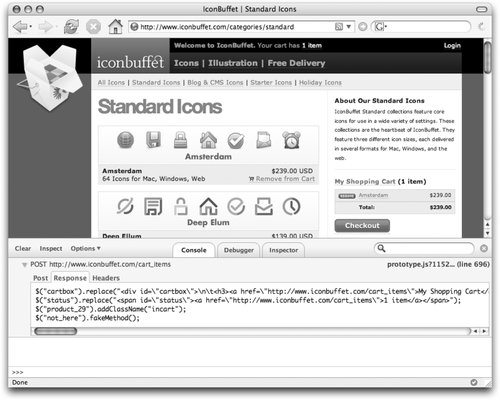 |