| Monitoring the system is one of the key responsibilities of a system administrator. You need to make sure that everything is as it should be on the system, or yell at people, call the cops, order a new hard drive, or whatever else is required. On a single-user system, there's really not much to do, but on a larger system with many users, monitoring is a significant part of a system administrator's job. Among other things, you can monitor the system logs (located in /var/log), the users logged in, and the overall system load. To Monitor Logs: sudo tail -1000 /var/log/messages  | more | more Use sudo to gain root access and look at the end (last 1, 000 lines) of the messages log file. The output of tail is piped to more so you can actually read it. Or sudo tail -f /var/log/httpd/error_log If you're looking for a specific occurrence of an event as it happens, you can use tail f to keep displaying the log as new errors, in the case of this log, are added to it. In this example, we're looking at the very end of the Web server's error log, as shown in Figure 16.3.
Figure 16.3. Monitoring logs is an important responsibility of the root user. 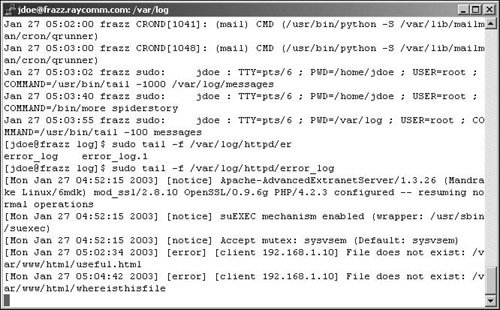
To Monitor Users: w; who You don't even need sudo for this one, but you do want to keep an eye on the users logged in, and where they're coming from. After a while, you'll get to recognize patterns and react to them. If jdoe usually logs in by 9 a.m. and logs out by 4 p.m., and always logs in from the same system, then you see jdoe suddenly logging in from a different address at 1 a.m., you should wonder if jdoe's secret password isn't quite so secret anymore. Or last The last utility tells you who logged in (and out) and when, and from where, as shown in Code Listing 16.5 (on the next page). Good stuff to know, particularly if you're not online and actively monitoring w and who all of the time.
To Monitor System Load: top Use top to monitor your system loads, as shown in Figure 16.4. Different systems will show distinctly different patterns, but if you get accustomed to checking top when everything seems normal on your system, you'll be able to better tell if something is abnormal or even what's wrong when the time comes. Press  to quit top. to quit top. Figure 16.4. The top utility helps monitor the system status. 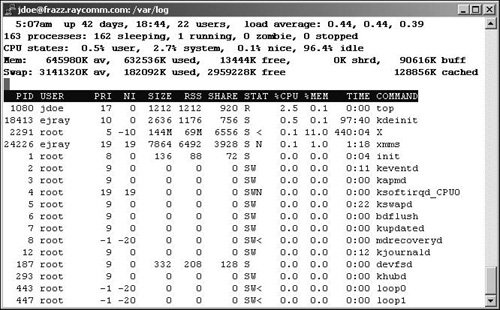
 Tips Tips
There's a lot to monitor and a lot to keep up with. Take time to read man pages, search the Web, and ask around for tips and tricks. A wide variety of additional utilities exist to make these processes easier for you. Develop shell scripts that automatically run when you log in and go through the "normal" system checks. By doing so, you don't have to do routine checks manually, and you can come up to speed quickly on what's going on. Use top d 2 | grep Mem for a running status check on your available memory. grep for other characteristics from top output, as appropriate. Anything that's different from usual is worth being concerned about. Check man pages or search the Web to find out for sure.
Code Listing 16.5. You can keep an eye on the users logged in and where they're coming from using w; who and last.| [View full width] [jdoe@frazz init.d]$ w; who 5:05am up 42 days, 18:42, 22 users, load average: 0.44, 0.40, 0.38 USER TTY FROM LOGIN@ IDLE JCPU PCPU WHAT root vc/1 - 15Dec02 42days 0.06s 0.06s -bash ejray pts/0 - 16Dec02 41days 0.00s ? - ejray pts/1 - Sat 6am 12:28m 0.88s 0.77s ssh mike ejray pts/2 - 28Dec02 28days 0.25s 0.25s /bin/zsh jdoe pts/6 192.168.1.104 4:58am 1:12 0.11s 0.02s tail -f /var/log  /httpd/ ejray pts/19 mike.raycomm.c Sat12pm 12:28m 1.05s 0.94s ssh sulley root vc/1 Dec 15 10:25 ejray :0 Dec 16 16:10 ejray pts/0 Dec 16 16:11 jdoe pts/6 Jan 27 04:58 (192.168.1.104) ejray pts/8 Dec 23 19:49 ejray pts/17 Jan 7 18:29 ejray pts/20 Jan 4 08:31 jdoe pts/16 Jan 13 19:39 (192.168.1.104) ejray pts/19 Jan 25 12:03 (mike.raycomm.com) ejray pts/22 Jan 25 12:03 [jdoe@frazz init.d]$ last jdoe pts/6 192.168.1.104 Mon Jan 27 04:58 still logged in jdoe pts/6 192.168.1.104 Mon Jan 27 04:57 - 04:58 (00:01) jdoe pts/6 192.168.1.104 Mon Jan 27 04:55 - 04:57 (00:01) jdoe pts/6 192.168.1.104 Sun Jan 26 18:05 - 20:16 (02:11) jdoe pts/6 mike.raycomm.c Sat Jan 25 12:12 - 06:52 (18:40) ejray pts/19 mike.raycomm.c Sat Jan 25 12:03 still logged in ejray pts/19 mike.raycomm.c Sat Jan 25 12:02 - 12:02 (00:00) jdoe pts/6 mike.raycomm.c Sat Jan 25 10:35 - 12:11 (01:36) jdoe pts/19 192.168.1.104 Tue Jan 21 20:59 - 00:11 (03:12) jdoe pts/19 192.168.1.104 Mon Jan 13 20:59 - 23:56 (02:57) jdoe pts/16 192.168.1.104 Mon Jan 13 19:39 - 23:34 (03:54) jdoe pts/23 192.168.1.104 Sun Jan 12 06:02 - 08:14 (02:12) jdoe pts/14 192.168.1.104 Mon Jan 6 20:54 - 23:42 (02:47) ejray pts/17 frazz.raycomm.co Thu Jan 2 20:50 - 06:27 (1+09:36) ejray pts/4 Wed Jan 1 04:55 gone - no logout wtmp begins Wed Jan 1 04:55:40 2003 [jdoe@frazz init.d]$ /httpd/ ejray pts/19 mike.raycomm.c Sat12pm 12:28m 1.05s 0.94s ssh sulley root vc/1 Dec 15 10:25 ejray :0 Dec 16 16:10 ejray pts/0 Dec 16 16:11 jdoe pts/6 Jan 27 04:58 (192.168.1.104) ejray pts/8 Dec 23 19:49 ejray pts/17 Jan 7 18:29 ejray pts/20 Jan 4 08:31 jdoe pts/16 Jan 13 19:39 (192.168.1.104) ejray pts/19 Jan 25 12:03 (mike.raycomm.com) ejray pts/22 Jan 25 12:03 [jdoe@frazz init.d]$ last jdoe pts/6 192.168.1.104 Mon Jan 27 04:58 still logged in jdoe pts/6 192.168.1.104 Mon Jan 27 04:57 - 04:58 (00:01) jdoe pts/6 192.168.1.104 Mon Jan 27 04:55 - 04:57 (00:01) jdoe pts/6 192.168.1.104 Sun Jan 26 18:05 - 20:16 (02:11) jdoe pts/6 mike.raycomm.c Sat Jan 25 12:12 - 06:52 (18:40) ejray pts/19 mike.raycomm.c Sat Jan 25 12:03 still logged in ejray pts/19 mike.raycomm.c Sat Jan 25 12:02 - 12:02 (00:00) jdoe pts/6 mike.raycomm.c Sat Jan 25 10:35 - 12:11 (01:36) jdoe pts/19 192.168.1.104 Tue Jan 21 20:59 - 00:11 (03:12) jdoe pts/19 192.168.1.104 Mon Jan 13 20:59 - 23:56 (02:57) jdoe pts/16 192.168.1.104 Mon Jan 13 19:39 - 23:34 (03:54) jdoe pts/23 192.168.1.104 Sun Jan 12 06:02 - 08:14 (02:12) jdoe pts/14 192.168.1.104 Mon Jan 6 20:54 - 23:42 (02:47) ejray pts/17 frazz.raycomm.co Thu Jan 2 20:50 - 06:27 (1+09:36) ejray pts/4 Wed Jan 1 04:55 gone - no logout wtmp begins Wed Jan 1 04:55:40 2003 [jdoe@frazz init.d]$
|
|