Summary
| < Day Day Up > |
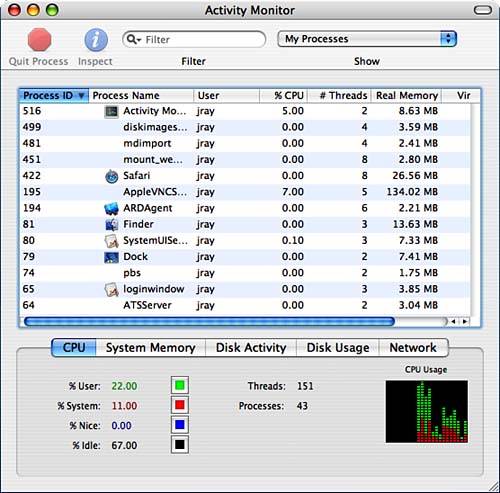
Managing Processes Graphically: Activity MonitorAs you know, pressing Option-Command-Escape opens a process list and enables you to force-quit open applications from the Tiger Finder. This is fine for many end-user applications, but doesn't provide the same depth of features that you can get from the command-line process management utilities. For those seeking more control, Apple's Activity Monitor application (path: /Applications/Utilities/Activity Monitor) provides information on all the system's processes, not just the GUI software that is running; consider it a much-improved graphical version of the top command discussed earlier in this chapter. Figure 12.2 shows the default Activity Monitor display. Figure 12.2. The Process Listing can show you everything that is running on your computer.
Controlling the Process ListingUsing the controls in the Process Listing screen, you can configure the type of output and amount of the information displayed. The Filter and Show features help limit the amount of data shown within the process listing. Typing into the Find field filters processes that match the given string. For example, typing Safari would limit the displayed processes to those that have the word Safari in their name. The Show pop-up menu filters processes based on the owner. You can change the setting to show the following categories:
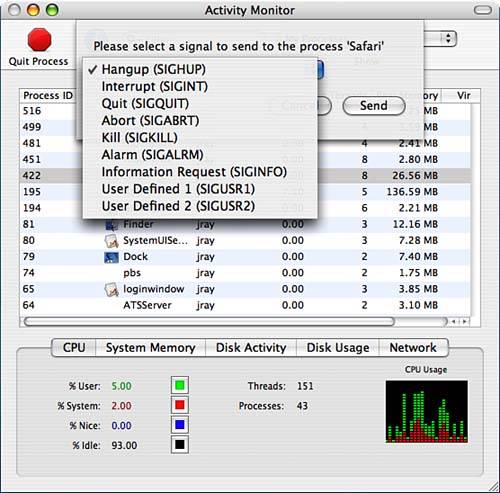
The process listing is not, as you might first think, a real-time view of the programs running on the system. The process information is always changing. To avoid overwhelming the user with a list that jumps all over the place, the process list is only updated every few seconds. Using the View, Update Frequency menu selection, you can change the rate at which the list is refreshed. The larger the number, the longer you must wait for updates. Processes are listed based on seven columns: Process ID, Process Name, User, % CPU, # Threads, Real Memory, and Virtual Memory. Each column can be sorted by clicking on the column heading. Click the small triangle in the upper-right corner of the process list to reverse the sorting order. A unique feature of Tiger's Activity Monitor is the ability to view process deltas (changes) rather than just the standard column readings. If, for example, you feel that a process might have a memory leak and you want to see whether the memory consumption is increasing, you can select the process in the list, choose View, Show Deltas for Process. The row will change to show only changes (+ or ) from the values displayed at the time you switched viewing modes. To export the current process listing to an XML file, choose File, Save. Killing and Signaling ProcessesThere are a number of ways that you can interact with processes through Activity Monitor. Using the toolbar icons or the View menu, you can inspect a process in the listing and, of course, quit it. As you learned earlier, telling the operating system to kill a process is really just a matter of sending a signal, such as TERM or HUP. To send a specific signal using Activity Monitor, choose View, Send Signal to Process. A dialog will appear listing the available signals to choose and send, as seen in Figure 12.3. Figure 12.3. Tiger's Activity Monitor can send specific signals to processes.
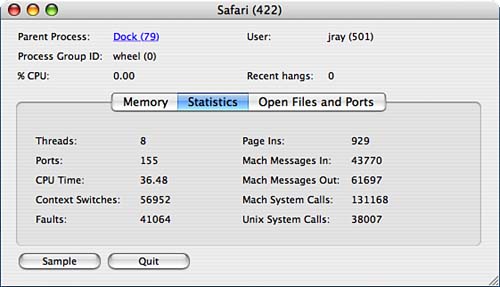
Displaying Process DetailsIf you want even more information about a process, you can double-click it within the listing or highlight it and click the Inspect (I) icon in the toolbar, or View, Inspect Process (Command-I). A detail window, shown in Figure 12.4, appears. Figure 12.4. View details about a selected process.
At the top of the detail window you can view the following information:
The middle portion of the process details window displays information about one of up to three categories, depending on which button in the button bar is highlighted: Memory, Statistics, or Open Files and Ports (not visible for all applications):
At the bottom of the details window are two buttons: Sample, and Quit. The Sample button takes a sample trace of the process execution over several seconds (this is mostly useful only for developers). The Quit button, as you might expect, offers you the options of quitting (gracefully) or force-quitting the process. Monitoring System StatisticsAt the bottom of the Activity Monitor window are controls for viewing CPU usage, System Memory, Disk Activity, Disk Usage, and Network activity. These provide an overview of all activity and usage across the entire system; they are not dependent on the processes selected in the process listing. Let's run through each pane and the information it contains. CPU UsageThe CPU pane, shown in Figure 12.5, displays the current activity level of the CPU(s) on your system. Figure 12.5. View your system activity level in the CPU pane.
Three types of activity are monitored:
The fourth value (idle) is actually just a lack of activity (100% minus the other three values). The total number of threads and processes is also displayed. To the right of the readouts is a scrolling graph that displays the three types of CPU activity.
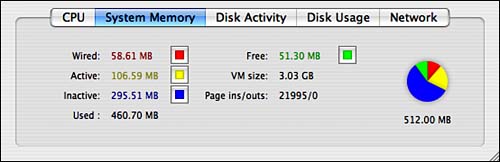
System MemoryThe System Memory pane shows the overall memory usage for the system, as displayed in Figure 12.6. Figure 12.6. Monitor your system's memory usage.
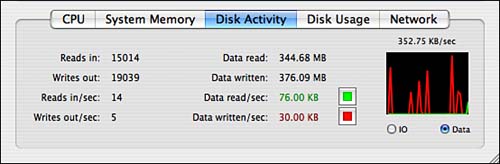
Although most of the data labels should be obvious (active memory, inactive memory, total used, and so on), the Wired reading might be confusing if you've never encountered it before. Wired memory cannot be written to virtual memory and must remain in real memory by the system. A properly operating idle system should not display an increase in real memory over an extended period of time. If it does, a memory leak in a system component (such as a device driver) might be slowly eating away at your resources. Disk ActivityThe third pane, Disk Activity, tracks your disk usage reads/writes on your drives. This pane is demonstrated in Figure 12.7. Figure 12.7. View the read/write activity on your local drives.
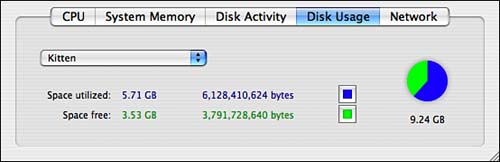
Disk UsageThe Disk Usage pane, shown in Figure 12.8, displays the amount of available free space on any of your currently mounted volumes. Figure 12.8. Monitor how much remaining space is available on your local and network volumes.
Use the pop-up menu in the Disk Usage pane to choose the drive you want to monitor. NetworkThe final pane, Network, displays the amount of data and packets going in and out of your active network interfaces. Figure 12.9 shows the Network pane. Figure 12.9. The Network pane can be used to monitor incoming and outgoing data.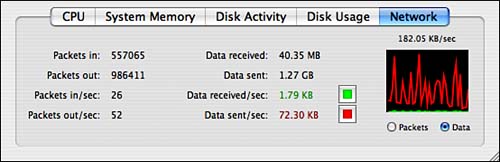 Creating Activity GraphsYou've already seen that the Activity Monitor is capable of producing graphs to display your CPU usage, among other things. However, keeping the Activity Monitor window open to view the graphs isn't realistic if you plan to use your computer for actual work. Thankfully, Apple provides a number of ways of displaying some of the information in floating windows or within the Dock icon. The View, Dock Icon menu provides access to most of these functions:
If you prefer floating windows rather than a Dock icon, use the CPU Usage and CPU History options under the Window menu. These create small windows with the normal close controls and so forth. You can also create an even smaller floating window that can be positioned on the menu bar or oriented horizontally or vertically by using the Window, Show Floating CPU Window submenu. |

| < Day Day Up > |
EAN: 2147483647
Pages: 251