Monitoring Lock Activity in SQL Server
| To monitor the performance of the system, it is necessary to keep track of locking activity in SQL Server. Following are the more commonly used methods to do so:
As you read through the rest of this chapter, you might want to examine or monitor the locking activity for the examples presented. To assist you in that effort, the remainder of this section describes the methods of examining lock activity in SQL Server 2000. Using the sp_lock Stored ProcedureThe stored procedure sp_lock provides a snapshot of the locks that are currently being held on resources by various commands and transactions in SQL Server. The syntax of sp lock is as follows : Exec sp_lock [SPID1] [,SPID2] Following is the sample output of this command: Exec sp_lock go spid dbid ObjId IndId Type Resource Mode Status ------ ------ ----------- ------ ---- ---------------- -------- ------ 51 8 0 0 DB S GRANT 51 1 85575343 0 TAB IS GRANT 53 8 1685581043 1 PAG 1:5798 IX GRANT 53 8 0 0 DB S GRANT 53 8 1685581043 0 TAB IX GRANT 54 8 1653580929 1 KEY (c6028dcecb9e) RangeS-S GRANT 54 8 1653580929 1 PAG 1:126 IS GRANT 54 8 1653580929 1 KEY (7601e649921b) RangeS-S GRANT 54 8 0 0 DB S GRANT 54 8 1653580929 1 KEY (bc023be5404b) RangeS-S GRANT 54 8 1653580929 1 KEY (b3018d0ff0ac) RangeS-S GRANT 54 8 1653580929 1 KEY (c70165b0fdb4) RangeS-S GRANT 54 8 1653580929 1 KEY (020285578a77) RangeS-S GRANT 54 8 1653580929 0 TAB IS GRANT 54 8 1653580929 1 KEY (c402f8d775ed) RangeS-S GRANT 54 8 1653580929 1 KEY (3803e05ac6f2) RangeS-S GRANT 54 8 1653580929 1 KEY (6e01b3d59a06) RangeS-S GRANT 54 8 1653580929 1 KEY (67018a3bdf5c) RangeS-S GRANT 54 8 1653580929 1 KEY (9e028a40b4ce) RangeS-S GRANT The columns in the sp_lock output provide the following information:
By default, sp_lock returns locking information for all processes in SQL Server. In a system with a large number of concurrent processes executing, this can generate a substantial amount of output. If you are interested in examining the locks for only one or two processes, you can specify the process ID ( spid ) for those processes as arguments to sp_lock . sp_lock will then display only the locks that are associated with those spid (s): exec sp_lock 53 spid dbid ObjId IndId Type Resource Mode Status ------ ------ ----------- ------ ---- ---------------- -------- ------ 53 8 0 0 DB S GRANT 53 8 1685581043 0 TAB IX GRANT 53 8 1685581043 1 PAG 1:5798 IX GRANT Additional examples of using sp_lock will be presented in other sections in this chapter where appropriate. Querying the syslockinfo TableThe information presented by sp_lock is retrieved from the memory resident table syslockinfo , which resides in the master database. The syslockinfo table contains information on all the locks currently granted or waiting to be granted in SQL Server. (The information contained in the syslockinfo table and the meaning of the values is described in more detail later in this chapter in the "Lock Types and the syslockinfo Table" section.) If you would like to see the information more directly, or you don't like the way the information is presented by sp_lock , you can write your own queries against the syslockinfo table to view and monitor the locking behavior. For example, sp_lock displays the database ID instead of the database name, and displays the object ID instead of the object name, even if run in the same database in which the object exists. It would also be helpful to display the login ID associated with the spid . Listing 38.1 provides an example of a query against the syslockinfo table. Listing 38.1 Example of a Query Against the syslockinfo Table select convert(varchar(30), suser_sname(p.sid)) as login, convert (smallint, req_spid) As spid, convert(varchar(30), db_name(rsc_dbid)) As db_name, case rsc_dbid when db_id() then convert(varchar(30), object_name(rsc_objid)) else convert(varchar(30), rsc_objid) end As Object, rsc_indid As indid, substring (lock_type.name, 1, 4) As Type, substring (lock_mode.name, 1, 12) As Mode, substring (lock_status.name, 1, 5) As Status, substring (rsc_text, 1, 16) as Resource from master..syslockinfo s join master..spt_values lock_type on s.rsc_type = lock_type.number join master..spt_values lock_status on s.req_status = lock_status.number join master..spt_values lock_mode on s.req_mode = lock_mode.number -1 join master..sysprocesses p on s.req_spid = p.spid where lock_type.type = 'LR' and lock_status.type = 'LS' and lock_mode.type = 'L' and db_name(rsc_dbid) not in ('master', 'msdb', 'tempdb', 'model') order by spid, lock_type.number go login spid db_name Object indid Type Mode Status Resource ----- ---- ------------- --------- ------ ---- ---------- ------ -------------- sa 51 bigpubs2000 NULL 0 DB S GRANT sa 53 bigpubs2000 NULL 0 DB S GRANT sa 53 bigpubs2000 stores 0 TAB IX GRANT sa 53 bigpubs2000 stores 1 PAG IX GRANT 1:5798 sa 54 bigpubs2000 NULL 0 DB S GRANT sa 54 bigpubs2000 sales 0 TAB IS GRANT sa 54 bigpubs2000 sales 1 PAG IS GRANT 1:126 sa 54 bigpubs2000 sales 1 KEY RangeS-S GRANT (7601e649921b) sa 54 bigpubs2000 sales 1 KEY RangeS-S GRANT (c6028dcecb9e) sa 54 bigpubs2000 sales 1 KEY RangeS-S GRANT (bc023be5404b) sa 54 bigpubs2000 sales 1 KEY RangeS-S GRANT (b3018d0ff0ac) sa 54 bigpubs2000 sales 1 KEY RangeS-S GRANT (c402f8d775ed) sa 54 bigpubs2000 sales 1 KEY RangeS-S GRANT (3803e05ac6f2) sa 54 bigpubs2000 sales 1 KEY RangeS-S GRANT (c70165b0fdb4) sa 54 bigpubs2000 sales 1 KEY RangeS-S GRANT (020285578a77) sa 54 bigpubs2000 sales 1 KEY RangeS-S GRANT (6e01b3d59a06) sa 54 bigpubs2000 sales 1 KEY RangeS-S GRANT (67018a3bdf5c) sa 54 bigpubs2000 sales 1 KEY RangeS-S GRANT (9e028a40b4ce) Note that to translate the integer values for the lock type, mode, and status, you need to do lookups against the values stored in the spt_values table in the master database. Also, the query contains a CASE expression for displaying the object name. If the database ID of the locked resource is the same as the current database context, it returns the object name; otherwise , it returns the object ID because the object_name() function operates only in the current database context. To save yourself the trouble of having to type in the query listed in Listing 38.1, or having to read it in from a file each time you want to run it, you might want to consider creating your own system-stored procedure that invokes this query. You can then use that stored procedure to monitor locks instead of sp_lock . (For more information on creating system-stored procedures, see Chapter 28, "Creating and Managing Stored Procedures in SQL Server.") Viewing Locking Activity with SQL Enterprise ManagerYou have seen that the output of sp_lock is somewhat unfriendly because it displays the IDs of the database and objects. The custom query against the syslockinfo table provides somewhat more user -friendly output. You can also use the SQL Server Enterprise Manager to display the locking information. To see the output from the Enterprise Manager, expand the server items, expand the Management folder, expand the Current Activity item, and click on either Locks/Process ID or Locks/Object to display the locking information in SQL Server.
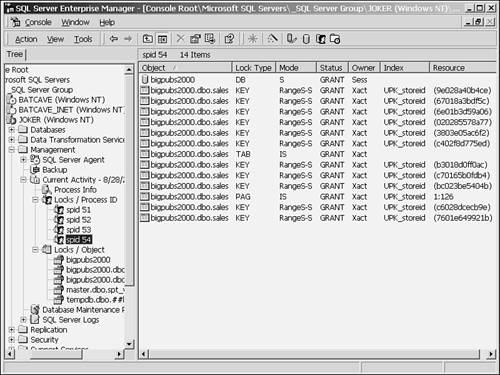
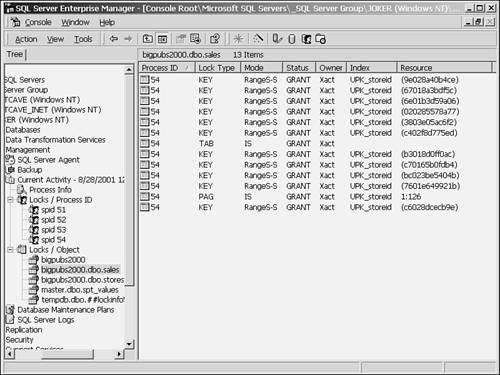
The Locks/Process ID item displays in the left windowpane a list of the processes that are currently holding locks in SQL Server. Clicking on one of the processes lists the locks currently being held by that process (see Figure 38.1). Figure 38.1. Viewing locks by Process ID using SQL Enterprise Manager. The Locks/Object item displays in the left windowpane a list of all the objects that currently have locks held on them. Clicking on one of the objects lists the processes currently holding locks on that object and the locks being held (see Figure 38.2). Figure 38.2. Viewing locks by Object using SQL Enterprise Manager. To display the command that was last executed by a process associated with a lock, you can double-click on an item in the right windowpane, or right-click on the item and select the Properties menu option. This will bring up a pop-up window containing the SQL text of the last command that was executed by that process.
Viewing Locking Activity with SQL ProfilerAnother tool to help you monitor locking activity in SQL Server 2000 is SQL Profiler. SQL Profiler provides a number of Lock events that you can capture in a trace. The trace information can be viewed in real time, or saved to a file or database table for further analysis at a later date. Saving the information to a table allows you to run different reports on the information to help in the analysis.
SQL Profiler provides the following lock events that can be captured in a trace:
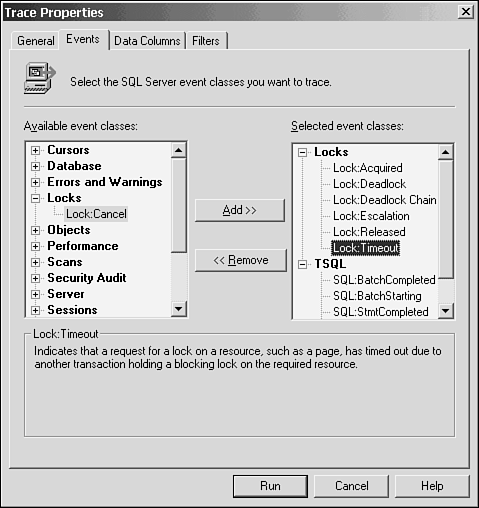
Figure 38.3 shows an example of choosing a set of locking events to monitor with SQL Profiler. Figure 38.3. Choosing lock events in SQL Profiler. SQL Profiler also provides a number of data values to display for the events being monitored . The following data columns are ones that you might find most useful when monitoring locking activity:
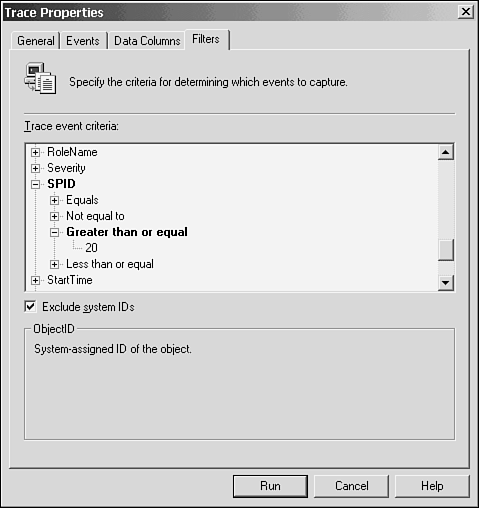
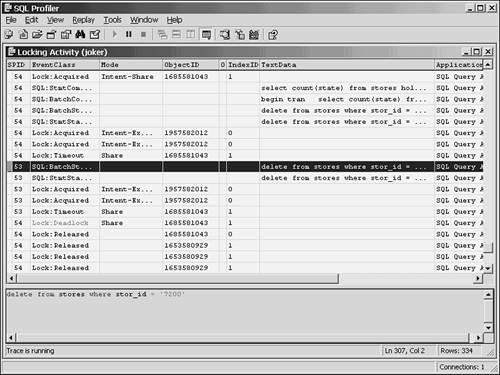
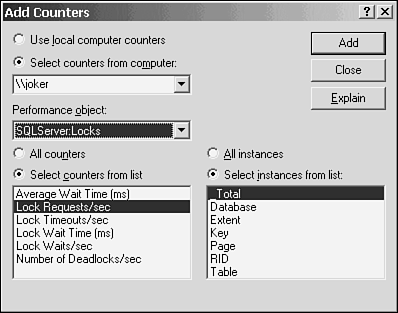
Keep in mind that many internal system processes also acquire locks within SQL Server. If you want to filter out those processes and focus on specific processes, users, or applications, use the filters in SQL Profiler to include the information you want to trace or exclude the information you don't want to trace (see Figure 38.4). Figure 38.4. Filtering out unwanted information in SQL Profiler. After you have set up your events, data columns, and filters, you can begin the trace. An example of the type of information captured is shown in Figure 38.5. Figure 38.5. Lock information captured in SQL Profiler trace. Viewing the Current Quantity of Locks with Performance MonitorAnother method of monitoring locking in SQL Server is through the Performance Monitor. The stored procedure sp_lock and Enterprise Manager provide a snapshot of the actual locks currently in effect in SQL Server. If you want to monitor the locking activity as a whole on a continuous basis, you can use the NT Performance Monitor and monitor the counters that are available for the SQLServer:Locks performance object (see Figure 38.6). Figure 38.6. Choosing counters for the SQLServer:Locks performance object in Performance Monitor. You can use the SQLServer:Locks object to help detect locking bottlenecks and contention points in the system, as well as to provide a summary of the overall locking activity in SQL Server. You can use the information that Performance Monitor provides to identify whether locking problems are the cause of any performance problems. You can then take appropriate corrective actions to improve concurrency and the overall performance of the system. The counters that belong to the SQLServer:Locks object are as follows:
For more information on using NT Performance Monitor for monitoring SQL Server performance, see Chapter 37, "Monitoring SQL Server Performance." |
EAN: 2147483647
Pages: 503