Monitoring Job Execution
| Frequently you might want to know what's going on with your job at any given time. This section is going to concentrate on monitoring individual SQL Server Agent jobs and global performance counters for the entire service. Looking at the Job HistoryAfter the Job Status dialog shows successful completion of the job, you can drill further into the job's history from the Object Explorer through selecting View History and bringing up the job step details (see Figure 8-6). Figure 8-6. Job history dialog.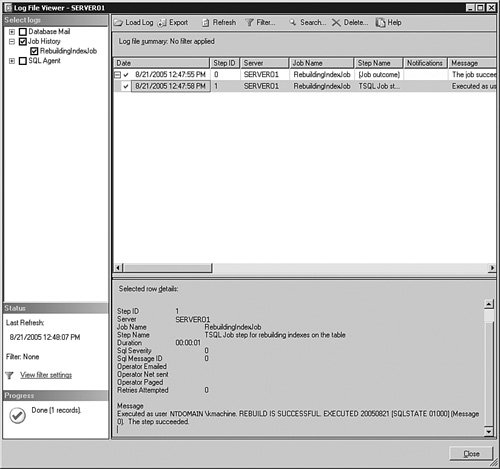 Notice how the step execution statistics appear in the bottom pane of the dialog, followed by the printed messages. Job Activity MonitorThe Job Activity Monitor is a powerful feature of SQL Server Management Studio that enables you to monitor the status of jobs defined on this system. You can view the Job Activity Monitor by double-clicking the last item in the Jobs folder of Object Explorer (see Figure 8-7). Figure 8-7. SQL Server Agent Job Activity Monitor.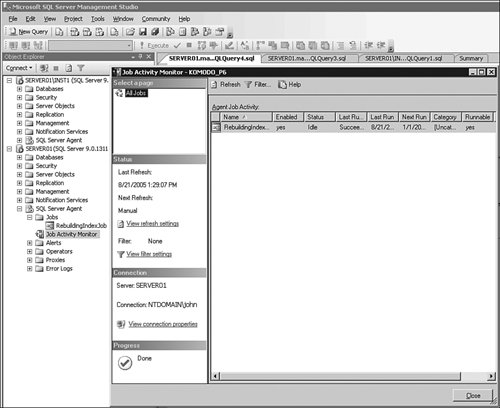 Using the Job Activity Monitor, you can filter out jobs in your view by applying a dynamic filter. You can also set a refresh rate for your view so job information can be updated at a regular interval. Tips and Tricks Job Activity Monitor uses the extended stored procedure xp_sqlagent_enum_jobs to bring job information into view. This retrieval mechanism has an inherent delay because the request must first reach SQL Server Agent and then fetch data from its internal memory structures and send this data back to SQL Server Database Engine as a resultset. If multiple requests are issued at the same time, they will be queued through synchronization mechanisms inside SQL Server Agent. A second issue with this approach is the volatility of this information; it is available only while SQL Server Agent is running. An immediate and more robust way to get job activity is to use the msdb.dbo.sysjobactivity table. SQL Server Agent uses this table to log success or failure of each job step immediately on execution. Moreover, when the SQL Server Agent service is restarted, a new session is created in the table, preserving old data. This can be especially useful if you are trying to recover after an unexpected failure or on a cluster failover. Because this table contains specific information about which job steps were in progress before a failure occurred, the administrator can decide which steps need to be re-run to assure full recovery of the system. SQL Server Agent itself cannot make this determination, but it can provide sufficient information for the user to take appropriate actions. SQL Server Agent Performance Monitor CountersAnother great way to look at the overall health of SQL Server Agent and monitor potential problems is through the Windows Performance Monitor. In SQL Server 2005, SQL Server Agent has several performance objects: SQLAgent:Alerts, SQLAgent:Jobs, SQLAgent:JobSteps, and SQLAgent:Statistics. Some of the most useful performance counters include Active jobs, Failed jobs, Queued jobs, and Activated alerts. You should look at the first three to make sure the job execution engine is functioning properly and the last counter to spot trouble areas. |
EAN: 2147483647
Pages: 149