The Deployment View
| I l @ ve RuBoard |
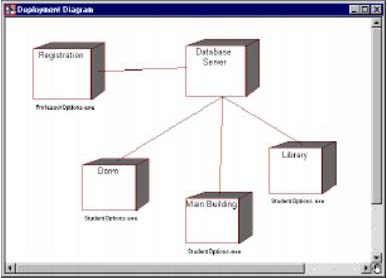
| This view of architecture involves mapping software to processing nodesit shows the configuration of run-time processing elements and the software processes living on them. The deployment view takes into account requirements such as system availability, reliability, performance, and scalability. Deployment diagrams are created to show the different nodes along with their connections in the system. The deployment diagram visualizes the distribution of components across the enterprise. Run-time processing elements are represented as nodes, which are connected by associations indicating communication paths between them. Software processes are illustrated as text attached to a node or group of nodes. This diagram allows the architecture team to understand the system topology and aids in mapping components to executable processes. Issues such as processor architecture, speed, and capacity, along with interprocess communication bandwidth/capacity, physical location of the hardware, and distributed processing techniques, all come into play. Deployment Diagram for the ESU Course Registration SystemAfter studying the component packages defined for the problem, examining existing hardware, and estimating the load on the system during the course registration period, the architecture team decided that they will need five processors for the systemone to handle the professor executable, one for the database, and three for student registration. CREATING THE DEPLOYMENT DIAGRAM IN RATIONAL ROSE
The deployment diagram for the ESU Course Registration problem is shown in Figure 11-11. Figure 11-11. Deployment Diagram |
| I l @ ve RuBoard |
EAN: 2147483647
Pages: 134