Summarized Reports
| < Day Day Up > |
Summarized ReportsSubsummary reports are perhaps the most useful and durable of all the reporting techniques in FileMaker Pro. It takes but little effort to extend a list report into a summary report, but the additional amount of information they can convey is significant. After you become comfortable with the basic techniques for creating subsummary reports, you'll find that they form an important part of your reporting repertoire . As a good place to start thinking about subsummary reports, consider the sample data set in Table 10.1. Table 10.1. Student Demographic Data
If this data set were to be presented in FileMaker Pro as a subsummary report, it might be structured something like the following:
You can easily see that the difference in the subsummary version is that the data has been grouped by gender. The heading for each particular group of data only appears once instead of redundantly on each record of the list. Using a Break FieldIn this example, the Gender field is acting as the break field . Understanding break fields is crucial for understanding subsummary reports. The break field is the column of data that determines what records appear with what grouping of information. The number of unique entries in the break field for the current found set of data (here, two: Male and Female) determines the number of groupings, or subsummaries, that will be present on the report. The purpose of a break field is to segment your data into useful subdivisions. As such, break fields are almost always categorical (rather than continuous) data elements. As an example, in a billing system you probably wouldn't choose to use an invoice total or invoice date field as a break field, but you might use an invoice type, invoice status, or invoice month field. The main purpose of subsummary reports is to enable you to "roll up" data to a less granular level, so that you see larger trends in your data that may be obfuscated when looking at simple lists. The break field defines how those larger trends will be manifested on your report. Thus, it makes no sense to use a field with unique values (that is, a primary key) as a break field because there's no grouping of records by common values that could possibly take place in such a situation. NOTE Break fields can be text, number, time, date, or timestamp fields, or a calculation that returns one of these data types. Fields with global storage should not be used as break fields because they provide no categorization of the data. Creating a Subsummary ReportThe physical creation of a subsummary report is quite similar to the creation of a simple list report. The Layout Wizard, in fact, has an option within the Columnar List/Report type to make your list a Report with Grouped Data. For our purposes here, we discuss how to turn a list report into a subsummary report. You can explore the wizard's capabilities on your own. Earlier in the chapter, we developed a Student Quiz Scores list report. Now that example will be extended into a subsummary report. Assume that each of the students has been assigned to a teacher (Donovan, Ferris, or Young); the present goal is to produce a subsummary report of the scores by teacher. Figure 10.7 shows the data from which the report will be generated (as a simple list). Figure 10.7. Any time data can be grouped according to a common element, you have the potential for a subsummary report. The first step to turning this into a subsummary report is to add a new part to the layout. It's possible to do this simply by clicking on the Part tool in the status area (in Layout mode, of course) and dragging a new part into existence. We prefer, however, to use the Part Setup dialog (select L ayouts, P a rt Setup) to create new parts . When you add a subsummary part to a layout, you must specify what break field should be represented by that part. In this example, shown in Figure 10.8, the Teacher field has been selected as the break field. Subsummary parts can be placed either above or below the body part. You can change the order of parts from the Part Setup dialog. Place a summary part above the body if you want it to act as a header for the data set; place it below if you want summary information about a subset of records to appear below the data set. You can (and indeed often will) place both a leading and a trailing subsummary part on a layout as well. Figure 10.8. The only time you'll be able to select from the field list in the right side of this dialog is when you choose the Sub-Summary When Sorted By option. After you've added a subsummary part to the layout, you next place fields, texts , and/or graphic elements in the part. Any objects that you place in the subsummary part appear on your report once for each group of data. You will typically place the break field itself in the subsummary part, but this isn't required. As is discussed shortly, any other fields that you place in the subsummary part are usually summary fields. Figure 10.9 shows what the new Quiz Scores by Teacher report looks like in Layout mode; the Teacher field and a horizontal line have been placed in the subsummary part. Notice also that the Teacher field has been removed from the body part, as it would be redundant. Figure 10.9. A subsummary part is used to display data relating to a set of records. TIP In Layout mode, the part labels can either appear as they do in Figure 10.9 ”as horizontal blurbs at the lower-left corner of the part ”or as rotated text along side of the part. Labels are easier to read as horizontal text, but they tend to get in the way, so we usually leave them along side of the parts. You can toggle between the two settings either by clicking on the part label orientation button (the 5th button in from the left at the bottom of your window) or by ( Before looking at the actual report, you must keep two points in mind at all times when working with subsummary reports. First, the found set of records must be sorted by the break field to be presented properly. In the quiz score report, this means sorting by the Teacher field before viewing the report. (It doesn't matter how it's sorted ascending , descending, or by the contents of a value list.) Second, you must be in Preview mode to view a subsummary report. Subsummary parts are simply not visible while you're in Browse mode. One of the implications of needing to be in Preview mode is that the user can't directly interact with the report in any way; buttons aren't functional in Preview mode. Users can, however, still run scripts from the script menu. TIP If you ever have problems with getting a subsummary report to work correctly, the first thing you should check is that you have the data sorted by the same field(s) that you're summarizing by and that you're in Preview mode. Figure 10.10 shows the completed (for now) subsummary report. Comparing this to Figure 10.7, it's easy to see how simply grouping data together according to a common data element makes it much easier to read. Figure 10.10. This subsummary report groups records together based on the contents of the Teacher field.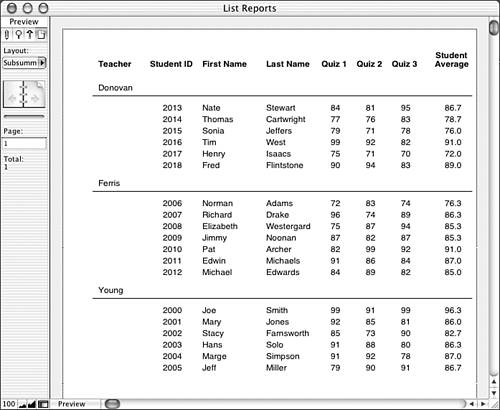 After you have a good grasp of the concepts at work in a basic subsummary report (like the one presented in this section), you can extend them in a number of ways to produce even more interesting and/or meaningful reports.
Using Summary Fields in Subsummary ReportsEarlier in this chapter, we discussed how you could add summary fields to a leading or trailing grand summary part to enhance a basic list report. Summary fields, not surprisingly, are also quite appropriate for use in subsummary reports. A summary field placed in a subsummary part generates aggregate results for each group of data presented in the report. You need to do nothing in terms of field definitions to make it work this way. After you've defined a summary field, you can place it in any subsummary part and it will be intelligent enough to act upon the correct group of records. In the example file we've been discussing, for instance, the summary field Average_Quiz1 is defined to be the average of the Quiz1 field. When this field is placed in a trailing grand summary, it displays the average of that field across the entire current found set. When it's placed in a subsummary (by teacher) part, it displays the average for each teacher's set of students. In Figure 10.11, a trailing subsummary by teacher and a trailing grand summary part have been added to the layout shown previously in Figure 10.9. The same four summary fields appear in both parts. The report generated by this layout is shown in Figure 10.12. Figure 10.11. Summary fields placed in a subsummary part calculate aggregate results for each group of data presented in the report. Figure 10.12. The leading and trailing subsummary parts can be thought of as providing a header and footer for each group of data presented in the report.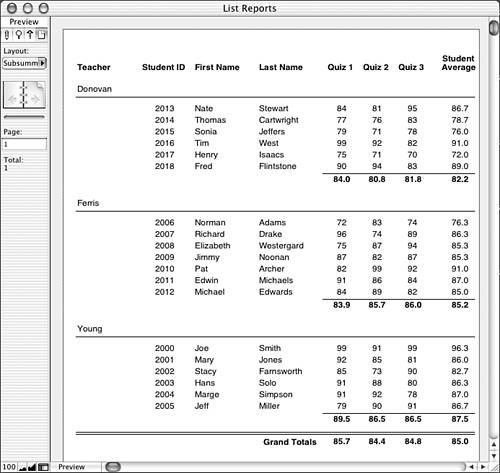 If another subsummary report were built that summarized on, say, students' genders or favorite pizza toppings, the same summary fields could be used in that report. Summary fields are thus quite versatile and powerful creatures . You'll find that after you've developed one subsummary report it's quite easy to duplicate the layout and change the break field specified for the summary part(s), thereby creating an entirely new and different report. For example, the layouts needed to generate Quiz Scores by Teacher, Quiz Scores by Gender, and Quiz Scores by Favorite Pizza Topping would be nearly identical to each other; you wouldn't need to modify the definitions of the summary fields in any way. CAUTION If you ever put a summary field into the body part on a layout, it displays, for every record, the aggregated result for the entire found set. Calculations Involving Summary FieldsAfter you begin using summary fields on reports, you're likely to come across situations where you need to perform some sort of calculation involving a summary field. For instance, in the Student Quiz database, imagine that Quiz 1 was a pre-test for a unit and that Quiz 3 was a post-test for the same unit. You might want to find out the change in scores from the pre-test to the post-test. For an individual student, you could generate this by simply adding a calculation field called something like ScoreIncrease , defined as Quiz3 - Quiz1 . But what if you wanted to find out the average increase for each class? Can you do math with summary fields? The answer to the last question is both yes and no. Summary fields shouldn't be used directly in calculation formulas. There's nothing to prevent you from doing so, but it's usually nonsensical to do so. Inside a calculation formula, a summary field is evaluated as the aggregate result of the entire found set. Thus, if you were to define a field called Average_ScoreIncrease as Average_Quiz3 - Average_Quiz1 , the result would be -0.84 no matter what record you were viewing or in what layout part you placed the field. This formula doesn't properly generate subsummary values. The solution to the problem is to use the GetSummary function. GetSummary takes two parameters: a summary field and a break field. When the current found set is sorted by the break field, this function returns the same value that would appear if the summary field were used in a subsummary layout part (based on the same break field, of course). If the found set is not sorted by the break field, the function returns the value of the summary field over the entire found set, which the astute reader should recall (from the preceding paragraph) is the same value returned by simply putting a summary field in a calculation without the GetSummary function. In the current situation, to produce a summary ScoreIncrease at the teacher level, the following calculation (called Average_ScoreIncrease_Teacher ) would be necessary: GetSummary (Average_Quiz3 ; Teacher) - GetSummary (Average_Quiz1 ; Teacher) This field could then be placed in the trailing subsummary part to display the results for each teacher. The fact that you must name a break field explicitly means that calculations involving summary fields aren't as re-usable as summary fields themselves. If you were making another report showing quiz scores by gender, you would need a new calculation field called Average_ScoreIncrease_Gender that specified Gender as the break field instead of Teacher. Similarly, for use in a trailing grand summary, you'd need yet another version of the formula that didn't use GetSummary at all. If this lack of reusability is a problem for you, then there actually is a way around the break field problem. The solution is to make a new field ”a global text field ”that you set (either manually or via script) to be the name of the break field that you need. Then you can dynamically assemble an appropriate GetSummary function and use the Evaluate function to return the proper value. Using this technique in the present example, you would just define a single Average_ScoreIncrease field with the following formula: Evaluate ( "GetSummary(Average_Quiz3; " & gSortValue & ")") - Evaluate ( "GetSummary Although the purpose of using a GetSummary function is to produce a value appropriate for display in a subsummary part, the values also display "properly" when placed in a body part. That is, each of the records of the subgroup knows the aggregate value for its particular set. This is distinctly different than the result of simply placing a summary field into a body part, in which case the value displayed represents an aggregation of the entire found set. Summarizing on Multiple CriteriaAll the examples thus far in this chapter have had a single summary criterion. It's but a small additional effort to produce a report that summarizes on multiple criteria. In fact, there's no practical limit to the number of subsummary parts that you can add to a layout, except perhaps your ability to make sense of the results. Summarizing based on multiple criteria is simply another way of categorizing a set of data. In the examples you've seen here, the student quiz scores have been grouped by teacher ”a single criterion. What if within each teacher's group of students, you wanted to subcategorize by gender? To accomplish this, you would add another summary part to your report layout. The subsummary part by gender would be positioned between the subsummary by teacher and the body. If you wanted trailing summary information as well, a second subsummary by gender would be placed between the body and the trailing summary by teacher. Figure 10.13 shows what such a layout would look like. Figure 10.13. To summarize on multiple criteria, create additional subsummary parts on your layout. To properly generate this report, you would need to make sure that your found set was sorted first by Teacher and then by Gender . The finished report is shown in Figure 10.14. If it were sorted by only one of those fields, then you would end up with a single criteria subsummary report; the other part would not be displayed on the report. This means that a single layout can generate several different reports, if just the sort criteria is changed. Figure 10.14. Typically when you develop a subsummary report based on multiple criteria, you should use dividing lines and/or indentation to clarify the report structure.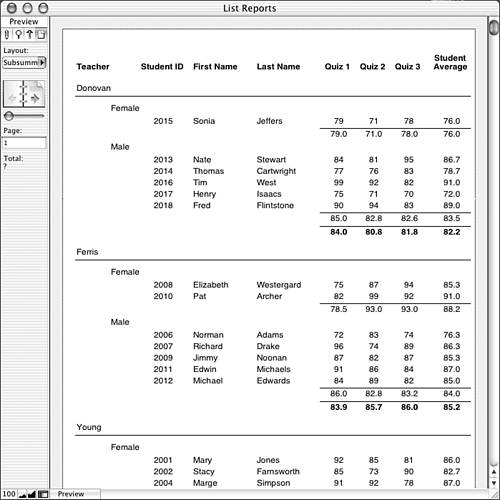 TIP If you were to sort the found set first by Gender and then by Teacher , your report might look a bit strange . That would have the effect of reversing the placement of the two subsummary parts; the data set would be separated first by gender, then within each gender by teacher. If you've built your report with any sort of indentation (as in these examples), then reversing the summary hierarchy would mean that the wrong headings would be indented. Reordering a Report Based on Summary DataWhen you create a subsummary report, the groups are ordered according to how you have sorted the break field. For example, in the Quiz Scores by Teacher reports, the groups are ordered as Donovan, Ferris, Young. A descending sort would have resulted in the groups being ordered as Young, Ferris, Donovan.
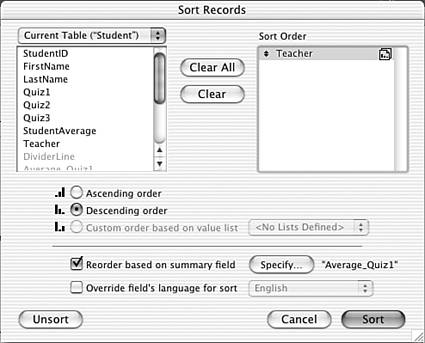
Figure 10.15. A new option in the Sort Records dialog in FileMaker Pro 7 is the capability to reorder the set based on a summary field. This enables you to generate ranking reports at a group level. NOTE The interface for reordering a sort based on a summary field is different in FileMaker Pro 7 than in previous versions. In FileMaker Pro 7, you can specify a reordering at any level of a multi-criteria subsummary report. The typical reason you would want to reorder your report based on a summary value is to produce group-level ranking reports. As an example, if the Quiz Scores by Teacher report used the sort shown in Figure 10.15, where the Teacher sort criteria is reordered by the value of Average_Quiz1 , the results would be the report shown in Figure 10.16. Notice that Young is the first group; her student average on Quiz 1 was 89.5. Donovan is next with a student average of 84.0, followed by Ferris at 83.9. Figure 10.16. Reordering the set by a summary field produces a group-level ranking report.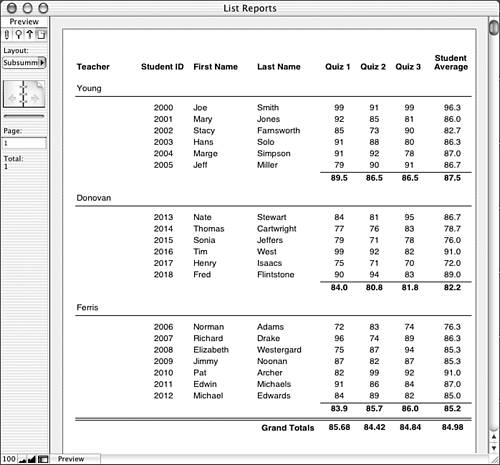 If you have a subsummary report with multiple summary levels, you can reorder the subgroups at any level of the report. When you do this, keep in mind that you can (and probably will) end up with a situation where the subgroups are ordered differently within the groups. That is, if you did a secondary sort by Gender (reordered by one of the summary fields) on the data in Figure 10.16, you would find that sometimes Male appeared before Female and that other times Female appeared first; each group's subgroups are ordered independently. Subsummary Reports with No Body PartIn a typical subsummary report, a subsummary part serves to organize and/or present summary data about a subgroup of data that is detailed on the report. All the subsummary reports presented so far in this chapter, in fact, fit this structure. But there's no reason why you can't remove the body part from your report, thereby just presenting some sort of listing of the groups themselves. Especially if your groups consist of large record sets, simply presenting the aggregated groups may result in a report that's much more meaningful. If a more detailed view of things is required, you can either provide it in a different report or simply allow users to perform ad hoc searches. TIP You can also allow users to toggle the body part "on and off" by redefining it as a subsummary by the primary key. That way, when the found set is sorted by the primary key, the faux body part is visible. When sorted by just the break field, it disappears. Figure 10.17 shows a quiz scores report in which the body part has been removed. The absence of a body part means that it's not necessary to have both a leading and trailing subsummary part; there's nothing that would appear in between them, so it's not necessary. Similarly, the only columns of the report are the break field ( Teacher ) and four summary fields. It doesn't make any sense to have fields like FirstName or StudentID because those aren't representative of an entire group of records. Figure 10.17. Without a body part, a subsummary report becomes a group-level list report. The subsummary techniques presented in this chapter represent just about everything you can do with a subsummary report. After you fully learn these techniques, you can pick and choose which ones you need to use to produce a given report. You'll also find that simply knowing the tools at your disposal will influence the way you design reports. The more you can design reports that work within the constraints of the tools, the easier it will be to generate those reports. |
 For more on the layout wizard,
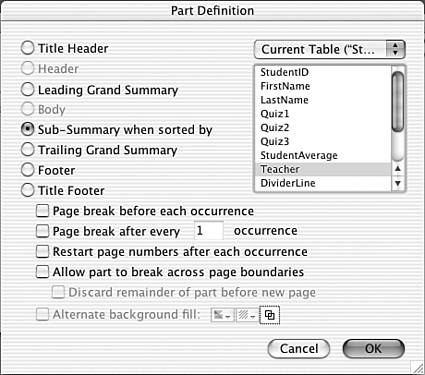
| < Day Day Up > |