FileMaker Extra: Managing the Relationships Graph
| < Day Day Up > |
| The new Relationships Graph in FileMaker 7 is a nice answer to developers who've clamored for years for a visual representation of relationships in FileMaker systems. But for large or complex systems, with many table occurrences, the Graph has the potential to be a bit unwieldy. Table occurrences in the Graph take up a fair amount of space, and it can be difficult to organize the occurrences without creating a web of overlapping relationship lines. You can use a number of tools for Graph management. For one thing, the small "window- shade " icon at the top right of a table occurrence can be used to hide the fields in the table occurrence, leaving only the match fields used in relationships. This can save valuable space (though there's no "all-off" or "all-on" switch you can toggle). Figure 7.33 shows a Relationships Graph in "windowshade" mode. Figure 7.33. Individual table occurrences can be made into "windowshades" that display only the match fields that participate in relationships.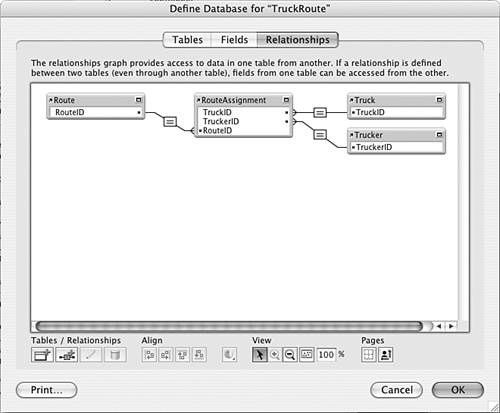 You can also resize an individual table occurrence manually to save space. This, again, needs to be done one table occurrence at a time. It's also possible to zoom out from the Graph as a whole and view it at 75% or 50% of regular size , or smaller. It might also be useful to you to organize your table occurrences into logical groups of some kind within the Relationships Graph. Let's say you're working on a trucking module with four table occurrences, and you also have a file reference to an external user-management module and you've used that to bring a number of user -oriented table occurrences into the Graph. FileMaker enables you to color -code table occurrences in the Graph, so it's possible to give each group of table occurrences its own color. It's even possible to create " dummy " table occurrences strictly for purposes of naming and separating, much as is occasionally done with scripts. Figure 7.34 shows a Relationships Graph with table occurrences both from the trucking module and the user module. The trucker tables are colored red here, the user tables blue, and each group has a "header" of a sort , formed by a dummy table occurrence. (We owe this labeling idea to Danny Mack and Todd Geist of New Millennium Communications). In addition, in the figure, the Graph has been reduced to 75% of its normal size. Figure 7.34. Use color coding and group naming to help organize the Relationships Graph.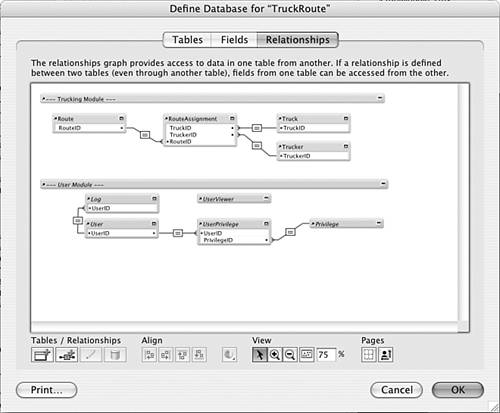 All these techniques can help make your Graph more manageable. Still, if you have a system with a hundred table occurrences, your Graph will be crowded, without question. It's been suggested that offering a list view of relationships as well, in a manner similar to previous versions of FileMaker, would be helpful, and it's possible we may see such a list view in future versions of the product. |
 For some more discussion of using the Relationships Graph as a kind of documentation tool,
 | < Day Day Up > |
- Structures, Processes and Relational Mechanisms for IT Governance
- Linking the IT Balanced Scorecard to the Business Objectives at a Major Canadian Financial Group
- Measuring and Managing E-Business Initiatives Through the Balanced Scorecard
- Governance in IT Outsourcing Partnerships
- The Evolution of IT Governance at NB Power