Using the Project Center Views
| < Day Day Up > |
| To use the Project Center, you must first log in to a Project Server using Project Web Access. When you are logged in to the Project Server, you find the Project Center by selecting the Projects main menu tab. The Project Center provides access to project information, as defined by your administrator. For the purposes of this discussion, it is assumed that the Project Web Access administrator has granted you permissions to view project data for the entire organization. You can access the Project Center from either Microsoft Project Web Access (by selecting Projects from the main menu) or from within Microsoft Project Professional (by selecting the menu sequence Collaborate, Project Center). Six primary functions are associated with the Project Center:
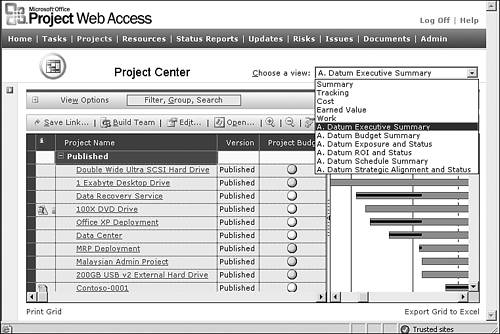
These topics are described in more detail in the following sections. Viewing Project Summary InformationYou can use the project summary views when you want to get an overview of all projects stored in the Project Server, as shown in Figure 26.1. Figure 26.1. Select the Choose a View drop-down list to change summary views. Using the Project Center's View Tab OptionsYou use the Project Center's View Options tab to refine the contents of the display. You can click on the View Options tab to see the list of View Options that are available, or you can click on the + and - icons on the left side of the tab to expand or collapse the View Options display. There are three Project Center view options:
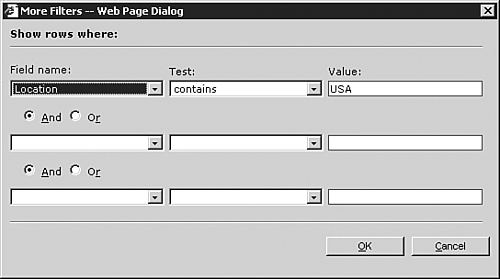
Using the Project Center's Filter, Group , Search TabSelect the Filter, Group, Search tab to display or hide the Project Center's filtering, grouping, and searching options. The following sections describe how Filter, Group, and Search work for Project Center views. Resource Center views behave in the same manner. Using Project Center FiltersYou can use Project Center's Filter option to filter the project list. There are three options for filtering the project list:
Using Project Center GroupsYou use the Group By function to sort the Projects in the Project Center into groups. The Group By function provides three drop-down list boxes, each of which defines a data field to group on. The Group By execution order is from left to right for each Group By field that is defined, with the results of each operation nested within the previous group's results for the listed projects. Grouping projects by an Enterprise Global Project outline code can provide useful information. Suppose, for example, that you want to see projects grouped by project version and location. If the Location enterprise outline code has been added to one of your project views, you can group the projects by version then location by performing the following steps:
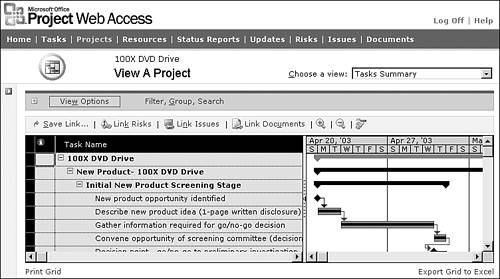
TIP Revert Using Project Center SearchesYou use the Search For option to quickly locate projects by entering a text string to search for, and the fields in which you want to search for the text. After the search criteria are specified, you click Find Next to display each project that matches the search criteria. As with the Group By function, the only fields available for searching are those that are defined as part of the current active view. Editing Enterprise Project InformationIf you examine Figure 26.3, you can see a button icon called Edit. If the Project Web Access administrator has given you permission, then you can click this button to see a screen that allows you to modify the Enterprise Global code values of the selected project. For example, your organization may have defined an Enterprise Global project code called Project Status that has the values Red, Yellow, and Green. The Edit function allows a project or portfolio manager to change the Project Status attribute to reflect the current status of the project. Viewing Project Detailed InformationIf you select a project name link from the Project Center summary views, you can see the details within the selected project as shown in Figure 26.4. Figure 26.4. You can review project details with various views. TIP Use the Save Link function to set special navigation links so you can quickly return to frequently needed detail views. Expanding and Contracting DetailsClick the small + and indicators to the left of project summary row text to expand or contract the selected section of the schedule. Then use the vertical and horizontal sliders at the right side and bottom edge of the detail window to see more schedule details. Manipulating Columns and RowsYou can reposition displayed columns by using your mouse to drag and drop a column header to the left or right. Then you can resize the column width by using the mouse to drag and drop the right edge of a column boundary. If you double-click on the right edge of a column header boundary, the column width will expand or contract to fit the maximum width of data within that column. You can also change the row height by using the mouse to drag and drop the lower boundary of a row. Every row within the schedule will expand or contract within this change. Linking Risks, Issues, and Documents to TasksAs you examine project details, you can also relate individual project tasks to risks, issues, and other artifact documents. Use the Link Risks, Link Issues, and Link Documents functions to relate a task to this type of collaboration information. If a task has a linked Document, Issue, or Risk, then a graphic icon will appear within the information column that is marked with an "i" in the column header. Using the Gantt ChartUse the Zoom-In, Zoom-Out, and Go-to-Task icons, positioned along the top of the view, to control the Gantt Chart display on the right half of the detail view. Then if you hover your mouse pointer over a particular Gantt Chart bar, an information pop-up will appear containing more data about the item. You can reposition the vertical split boundary between the task details and the Gantt Chart parts of the display. Use your mouse to drag-and-drop the boundary, or double-click the vertical boundary to resize it to a column edge. Using the Print Grid Option
Using the Export Grid to Excel Option
|
 For details on how to add Enterprise Global Project outline codes to views,
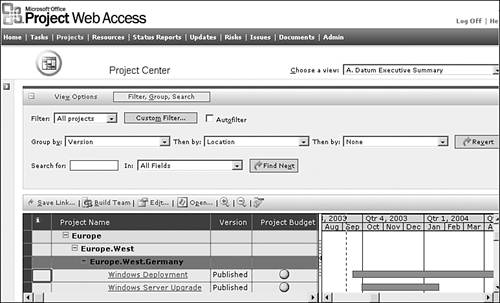
| < Day Day Up > |
EAN: 2147483647
Pages: 283
- Using SQL Data Manipulation Language (DML) to Insert and Manipulate Data Within SQL Tables
- Working with Functions, Parameters, and Data Types
- Working with SQL JOIN Statements and Other Multiple-table Queries
- Writing External Applications to Query and Manipulate Database Data
- Working with Data BLOBs and Text