| The Network Diagram view, which is particularly useful in the planning phases, provides a look at a project's logic and flow. You can customize the Network Diagram view by changing the shape, size , and borders of the nodes; by creating named data templates that specify fields to display within each node; and by applying layout characteristics to task nodes. You can also change your perspective by zooming in or out to see more or less of the entire project and by applying a filter or grouping to the diagram. An overall description of the Network Diagram view is included in the section "Working with the Network Diagram View" in Chapter 7, "Viewing Your Schedule." The following sections discuss the extensive formatting and layout possibilities for the Network Diagram view.  | The Format menu for the Network Diagram view contains the options Box, Box Styles, and Layout. You can also use the Zoom option on the View menu or the Zoom In and Zoom Out buttons on the Standard toolbar. |  Notice that the Network Diagram view does not have a timescale displayed across the top of the view like the Gantt Chart view does. The diagram can move left, right, up, or down and still proceed "forward in time." For this reason, the Network Diagram view is very helpful in assessing the logical flow of the project and to review the sequencing of the tasks . |
Using the Format menu to change the display of text is covered earlier in this chapter. The Zoom, Layout, and Layout Now commands are covered in previous sections but are summarized in the following sections for completeness. The Box Styles commands are covered in detail in the following sections. Using the Box Styles Options You can customize the boxes that surround the nodes to display 10 node shapes , 4 border widths, and a variety of border colors. There are also options for background colors and patterns. Choose Format, Box Styles or double-click an open space in the Network Diagram view. The Box Styles dialog box appears (see Figure 20.23) and shows the formatting options for box styles, borders, and colors. Figure 20.23. You can set formatting options for categories of tasks in the Box Styles dialog box. 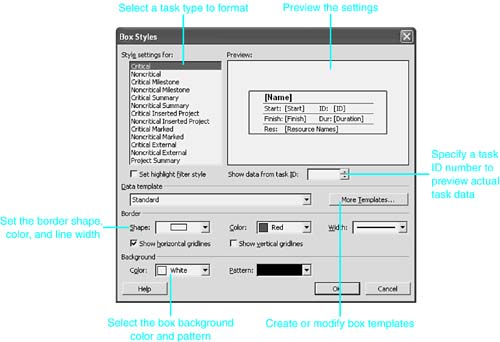 The default box styles are assigned according to types of tasks. Critical tasks of any type, such as Milestone tasks or Summary tasks, are outlined in red and have white backgrounds. Noncritical tasks are outlined in blue and have aqua backgrounds. The default shapes are rectangles for normal tasks, four-sided parallelograms for summary tasks, and six-sided boxes for milestones. By default, Project sets the formatting for boxes displayed in an applied highlight filter to be the same shape as nonhighlighted nodes but with the background color changed to yellow. You can turn on the Set Highlight Filter Style option to review or modify the highlight settings for node types. Project provides 17 border colors that you can apply to shapes. If you have a color printer or plotter, the use of color can be an effective tool. With a grayscale printer, you can't distinguish one color from another; therefore, you need to change the border colors or box patterns to distinguish types of tasks. You can set the Show Horizontal Gridlines and Show Vertical Gridlines options to view or suppress cell dividers in the node both onscreen and in printouts. TIP To see how the style settings look with actual task information instead of the provided generic preview, enter a valid task ID number in the Show Data from Task ID entry box below the Preview area of the Box Styles dialog box.
Using Data Templates for Network Diagram Nodes You can control the contents and the row and column layouts within each node by defining and applying data templates to the node types. Node definitions in a template include the following elements: -
Box cell layout of up to 16 cells in a 4-rowx4-column grid -
Cell width sizing for all cells in a box -
Vertical and horizontal alignment settings for the contents of each cell -
Up to a maximum of three lines of text to be displayed in cells -
Descriptive labels inserted in front of data in each cell -
Font size, style, and color options for each cell -
Fields that appear in each of up to 16 cell positions -
Date formats for Network Diagram view displays Initially, the contents and layout of boxes are defined by supplied templates. The standard template, which is used for normal critical and noncritical tasks, displays six fields of information in a 4-rowx2-column grid: Name, ID, Start, Finish, Duration, and Resource Names. The Milestone template follows 3-rowx1-column format and displays the task name, task ID, and start date. Summary tasks are assigned a third template, with six fields of information in a 4-rowx2-column grid very similar to the Standard template: Name , ID, Start, Finish, Duration, and % Complete. To create additional Network Diagram data templates for box formatting, follow these steps: -
Choose Format, Box Styles to display the Network Diagram Box Styles dialog box. -
In the Box Styles dialog box, click the More Templates button. The Data Templates dialog box appears, as shown in Figure 20.24. Figure 20.24. In the Data Templates dialog box, you can preview a generic sample of a data template or specify a valid task ID to view actual task values.  -
Click the Import button to bring up a box style template definition from within the current file or one that has already been created in another file. Any second file that is needed must already be open to allow this import to take place. -
To create a new data template, click New. To use an existing template as a starting point, click Copy or Edit. NOTE You cannot edit the supplied Standard data template. However, if the standard definition is close to what you want, you can make a copy of the Standard template and edit the copy. -
Set the options for the new template in the Data Template Definition dialog box (see Figure 20.25). Figure 20.25. You can control cell layout and individual cell settings in the Data Template Definition dialog box. 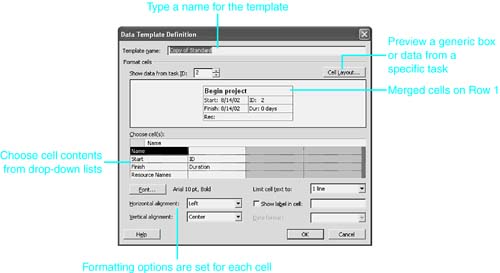 -
Give the new template a name by typing in the Template Name entry area. -
Click the Cell Layout command button to display the Cell Layout dialog box (see Figure 20.26). Figure 20.26. You can adjust the box grid and cell width in the Cell Layout dialog box.  -
In the Cell Layout dialog box, choose the number of rows and columns for the new diagram box. You can also expand or contract the setting for cell widths. -
Also in the Cell Layout dialog box, make a selection for handling cells that are left blank. (In Figure 20.25, the standard data template contains a blank cell on Row 1, in Column 2. The Merge Blank Cells with Cell to the Left option is selected in the template definition, so the Name field appears to occupy two cells instead of one.) -
Click OK when the cell layout is complete and you are ready to return to the Data Template Definition dialog box. -
In the Data Template Definition dialog box, make selections for font, alignments, and number of text lines for each individual cell. Click each cell in the Choose Cell(s) area and make selections. Add a prefix label to any or all cells, and then select a date format for date cells if desired. NOTE To select and change settings for more than one cell at a time, click and drag, Shift+click, or Ctrl+click to select multiple cells. -
Click OK when you're finished with the template definition. Then click Close in the Data Templates dialog box. -
In the Box Styles dialog box, apply data template settings to nodes by choosing a task type in the Style Settings For list and choosing a data template from the drop-down list. -
Click OK when you're finished. Your changes are immediately reflected in the Network Diagram view onscreen. Controlling the Network Diagram Layout The layout in a network diagram is controlled by setting options in a Layout dialog box or by using the Layout Now command to force Project to refresh the display. After the general layout is defined and applied, you can apply task filters and group definitions to the diagram and hide tasks by collapsing summary tasks in the outline. Selecting Layout Options The Layout command on the Network Diagram Format menu controls the overall look and feel of the Network Diagram view, as opposed to the appearance and contents of individual network nodes. You can choose options for box layout order and spacing, style of box connection lines, color of linking lines, diagram background style and color, drawing of task progress lines, and whether the diagram is laid out automatically or you have manual control of the box placements. To set layout options for the Network Diagram view, follow these steps: -
Display the Layout dialog box shown in Figure 20.27 by displaying the Network Diagram view and choosing Format, Layout. Figure 20.27. The overall Network Diagram view appearance is controlled by the Layout dialog box settings. 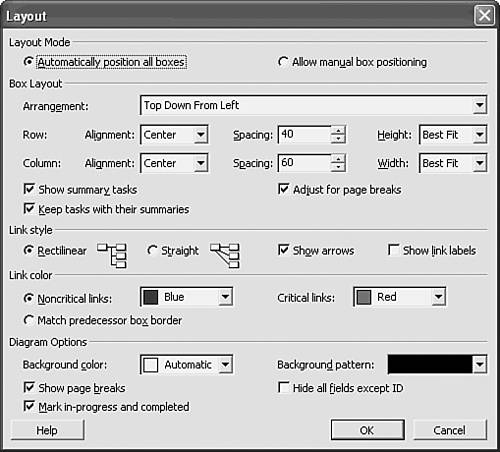 -
In the Layout Mode area, choose Automatically Position All Boxes to have Project maintain the onscreen layout or choose Allow Manual Box Positioning to allow click-and-drag movement of the boxes. -
In the Box Layout area, use the drop-down lists and spinners to set row alignment, spacing, and height, as well as column alignment, spacing, and width. These settings are relative to those for other like elements; for example, a row alignment of Center places all boxes on a single horizontal row so that the box midlines form a straight line. Similarly, a column alignment of Left positions all boxes in a vertical column to display with left box edges aligned. NOTE Box sizes (height and width) might vary depending on the data template settings that are applied to box types. For more information, see the section "Using Data Templates for Network Diagram Nodes," earlier in this chapter. -
The Arrangement drop-down list in the Box Layout area determines in what order Project draws the diagram. The standard, and default, arrangement is Top Down from Left. Figure 20.28 shows the Network Diagram view for the beginning of the plan, drawn in Top Down from Left order. Most network diagrams are drawn this way. Figure 20.28. The standard diagram arrangement is Top Down from Left, with rectilinear linking lines and dotted page breaks displayed. 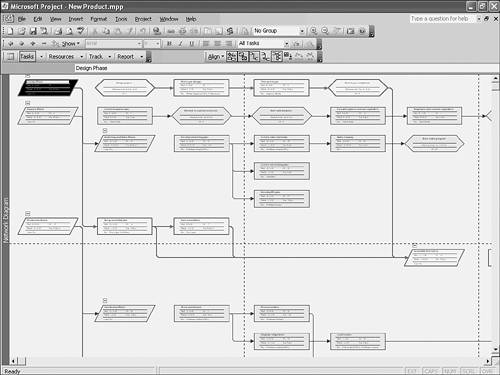 TIP You can temporarily enlarge a box to more easily view its contents by moving the mouse pointer over the box and pausing. By comparison, Figure 20.29 illustrates how the top-left section of the Network Diagram view would look if the arrangement option of Top Down by Month was applied. This figure is set to a zoom percentage of 75% (see the section "Using the Zoom Command," later in this chapter). Each column of nodes represents a month in the project; within columns, boxes are in ID order. Figure 20.29. A Top Down by Month drawing of the Network Diagram view gives a good representation of the plan over time. 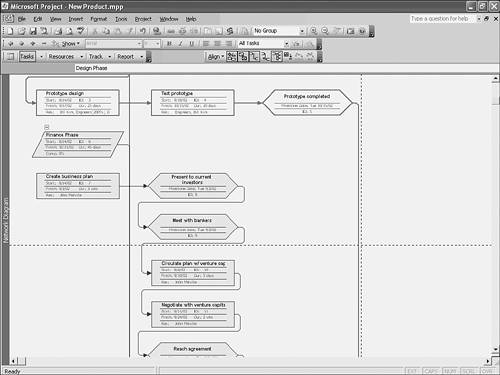 -
In the Box Layout area of the Layout dialog box, make selections to show summary tasks, to keep tasks with their summaries when changing the layout arrangement, and to adjust for page breaks so that boxes can't be split and printed partially on more than one page. -
Choose options to determine whether lines between diagram boxes are straight or rectilinear (that is, squared). Choose Show Arrows to indicate successor direction between nodes, and choose Show Link Labels to include a small dependency type label (FS, SS, FF, SF) on each linking line. -
Select color and pattern options for linking lines and for the diagram display background. -
Two very helpful options are available at the bottom of the Layout dialog box. Show Page Breaks enables you to see onscreen how the printing lays out without having to go to Print Preview. Turn on the Mark In-progress and Completed option to draw a top left-to-bottom right diagonal line across boxes for tasks with some progress and an additional diagonal line through completed tasks. -
You should use the Hide All Fields Except ID option if you're viewing and printing the overall structure of a plan and don't want to display any task details (see Figure 20.30). Figure 20.30. You can print a condensed schematic of the plan by hiding all fields except ID.  -
Click OK after you have made all the needed selections. There is set logic behind each of the arrangement options in the Layout dialog box. When Top Down from Left is selected, Project redraws the Network Diagram view according to the following standard rules of node placement: -
Successor tasks are placed to the right of or below their predecessor tasks. -
Summary tasks are placed above and to the left of their subordinate tasks. -
Linked task nodes are connected with straight lines (or diagonal lines, if necessary), and an arrow is placed at the successor task's end of the line to indicate the direction of the relationship. Other arrangement options apply similar rules. Project includes a toolbar that is specific to Network Diagram view formatting. By using this toolbar, you can quickly apply many of the options in the Layout dialog box. Choose View, Toolbars, Network Diagram to turn the toolbar on (or off). Its buttons and their actions are described below in Table 20.2. Table 20.2. The Network Diagram Toolbar | Toolbar Icon | Tool Name | Action | |  | Align | If manual positioning has been turned on, you can use this tool to line up task nodes by their edges, centers, or midlines | |  | Hide Summary Tasks | Toggles on and off to hide summary tasks | |  | Show Progress Marks | Toggles to show (diagonal) progress marks on nodes | |  | Show Page Breaks | Toggles to show page breaks onscreen | |  | Show Link Labels | Toggles to show link labels (FS, SS, FF, SF) on lines connecting the nodes | |  | Straight Links | Displays task connecting links as Straight Links (toggles with rectilinear linking lines) | |  | Hide Fields | Hides all fields except task ID. It toggles with full node displays | |  | Layout Now | Instructs Project to redraw the screen and apply the format or manual position changes | |  | Layout Selection Now | Limits the application of changes to selected tasks only | Controlling Box Placement in the Network Diagram View If the Allow Manual Box Positioning option is turned on in the Layout dialog box, you can drag the boxes of the diagram around and reposition them to improve clarity. To reposition a node manually, place the mouse pointer over the edge of a node, hold until the mouse pointer shape changes to a four-pointed arrow, and then click and drag the border edge. You can also select the node and use Ctrl+arrow keys to move it. The manual positioning stays in place until Layout Now is executed, even if the file is closed and reopened later. TIP | | Hiding all fields except ID, as shown in Figure 20.30, is such a useful feature that it is accessible three ways: You can access it in the Layout dialog box, you can right-click on the diagram background, and you can click the Hide Fields button on the Network Diagram toolbar. |
Any predefined or custom task filter can be applied to a Network Diagram view. After displaying the diagram, choose Project, Filtered For to apply one of the commonly used filters. Project 2003 provides the ability to apply group definitions to the diagram. Figure 20.31 shows the task nodes grouped into noncritical and critical task sections. Figure 20.31. Project 2003 grouping capabilities offer some ways to display task nodes. 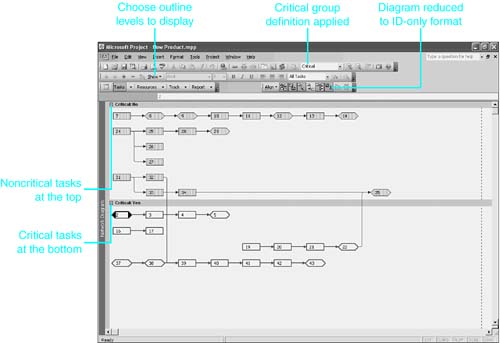  | Another way to control the Network Diagram view display is to set the outline detail level to be displayed. The Show button on the Formatting toolbar enables you to choose what levels of subtasks are displayed. You can also collapse and expand individual summary tasks on the screen by clicking the + or symbol above each summary task. |  For more information on creating a task outline, see "Outlining the Task List," p. 154 . For more information on creating a task outline, see "Outlining the Task List," p. 154 .
Using the Zoom Command When you are working in the Network Diagram view, it is often helpful to change the perspectiveeither pulling back to see the big picture or moving in closer for a more detailed view. This feature is especially useful when you manually move the nodes around to redesign a chart. | | When you use the Zoom In and Zoom Out buttons, you are moved through the various preset zoom levels. When you use either the shortcut menu or the View menu, the Zoom dialog box appears. You can choose any of the preset zoom values or enter a value between 25% and 400% in the Custom text box. | |