| After you review the big picture, it might become clear that the plan must be realigned to meet the strategic objectives of the project. The following sections suggest strategies for reviewing the plan in more detail in order to realign the plan with the initial project objectives. Shortening the Critical Path Your review might indicate that the project is now finishing late. It is therefore necessary to reduce the overall duration of the project, to schedule the finish date sooner (or the start date later, for a project that is scheduled from the finish date). The popular phrase for this process is crashing the schedule . In order to affect the finish date, it is necessary to first identify the tasks that are directly affecting the project finish datethe critical path and second, to make necessary revisions to those tasks. Identifying the Critical Path  | You can use any task view to identify critical tasks. One powerful view for identifying and crashing tasks on the critical path is the Task Entry view. This combination view consists of the Gantt Chart view over the Task Form view. The Gantt Chart view will allow you to pinpoint critical tasks, and the Task Form view will allow you full control over Project's primary scheduling engine components necessary to crash critical tasks. In addition, you can use the Network Diagram view to identify critical tasks. This view, however, is not very effective for crashing critical tasks. |  | Probably the most dramatic way to identify critical tasks is to use the Gantt Chart Wizard, which you activate by selecting Format, Gantt Chart Wizard. |  It is important to distinguish between critical activities and important ones. These terms are often used interchangeably, but they mean different things to a formally trained project manager. Critical tasks are important to a project because they contribute to the longest path through the project and, thereby, dictate the earliest possible finish date. Important tasks, however, might or might not be critical. |
 To learn how to format the Gantt Chart view to display the critical path by using the Gantt Chart Wizard, see "Formatting the Gantt Chart View," p. 790. To learn how to format the Gantt Chart view to display the critical path by using the Gantt Chart Wizard, see "Formatting the Gantt Chart View," p. 790.
Another alternative is to filter the task list to show only critical tasks. However, as you redefine the project, some tasks might change from noncritical to critical (and vice versa). When relying on the Critical filter while editing, remember to reapply the filter following each edit by pressing Ctrl+F3. After critical tasks are identified, it may be necessary to make revisions to realign the project. Reducing the duration of individual tasks might be no more complicated than reassessing the estimated duration and entering a more optimistic figure. Often, however, reducing the overall duration of the project requires much more effort. Strategies for Crashing the Schedule No matter which view you use, you can move through the project from one critical task to the next , looking for opportunities such as the following to crash the schedule: -
Re-estimating duration estimates or changing the scope You can remove critical activities or re-estimate the duration of critical tasks, which means changing the scope of the project or removing any padding from duration estimates. By removing activities, you often cut from the specifications of the project. Cutting the estimate may require that you need to do the same amount of work in less time. Assuming that your duration estimates are not padded , changing scope in a well-defined , closely assessed project typically means compromising content or quality. Basically, you need to remove tasks from the project or compromise quality (perform the work in less time) to get work done. -
Assigning additional resources Assigning additional resources to an effort-driven task means that the same amount of work gets done in less time. With an effort-driven task, if one resource can perform the work of a task in one week, two resources may be able to perform the same amount of work in half a week. However, the law of diminishing returns can actually limit the effectiveness and create an unrealistic schedule. Adding additional resources may increase the total work and cost of a task due to greater communications needs. -
Making changes in task relationships You can examine the predecessor and successor relationships and try to identify discretionary dependencies that you can change from Finish-to-Start to one of the overlapping relationships (Start-to-Start or Finish-to-Finish) with lag time applied. This strategy is usually most beneficial because many users hastily define most relationships as Finish-to-Start, even though more lenient definitions could be applied. Ask whether the predecessor to the task really needs to be 100% complete before the successor can start, or whether almost finished or partially finished would suffice. -
Scheduling overtime One additional strategy to crash the critical path is to schedule overtime work for resources on critical tasks, therefore reducing regular work hours each day. You might find it easiest to concentrate on each of these strategies if you go through the project task list once for each of the strategies listed. Remembering what you are looking for is sometimes easier if you look for the same thing as you examine task after task. After you make changes, remember that some formerly noncritical tasks may now be critical; therefore, a new set of tasks may be able to be crashed. A useful combination view at this point to study activity relationships is the Gantt Chart view in the top pane and the Relationship Diagram view in the bottom pane. This combination view allows you to analyze predecessor and successor relationships for the selected task in the bottom pane in a network diagram type format (see Figure 12.10). Figure 12.10. The Relationship Diagram view in the bottom pane provides visual verification of task predecessors and successors. 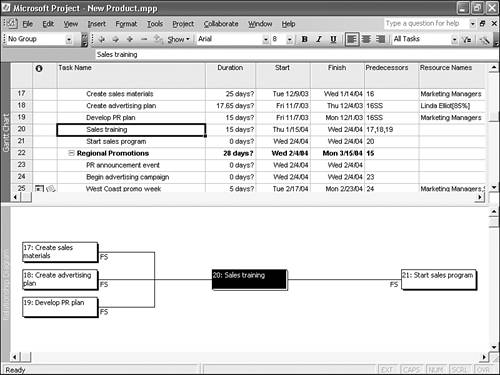 To learn more about the Relationship Diagram view, see "Exploring the Standard Views," p. 736.
For information on creating custom views that consist of one view in the top pane and another view in the bottom pane, see "Creating New Views," p. 834.
Reducing Costs To reduce project costs, you can examine the project schedule to look for possible cost savings. There are two types of costs associated with each task: variable costs and fixed costs. Because variable costs all derive from resource assignments, you might want to focus on ways to reduce the cost of the resources that are assigned to individual tasks. To learn more about how Microsoft Project determines cost, see "Understanding Resources and Costs," p. 279 , and "Assigning Fixed Costs and Fixed Contract Fees," p. 396 .
Reviewing the Cost Schedule You can see the total for each task if you apply the Cost table to the task sheet in the Gantt Chart view or the Task Sheet view. If you choose Window, Split to display the Task Form view in the bottom pane, and then choose Format, Details, Resource Cost, you can view resource assignments, including cost for each assignment in detail. If you want to focus on only tasks with costs in excess of some predetermined amount, you can create a filter to display only these tasks. To build your own filters, see "Creating Custom Filters," p. 859 .
To learn more about using views, tables, and filters, see Chapter 19, "Using the Standard Views, Tables, Filters, and Groups," p. 735 .
Strategies for Reducing Costs Using less expensive resources that perform the same quality of work as more expensive resources in the same amount of time will obviously lower your costs. You may also be able to reduce costs if you can substitute with more expensive but more efficient resources. You can justify the extra cost if the number of hours of work to complete the task is reduced more than proportionally. For example, if you can reduce work hours 25% by substituting with a resource with a standard rate 20% higher than the old resource, the substitution would result in a cost savings. For example, an eight- hour task with a $10/hr resource assigned would cost $80. If a $12/hr resource could accomplish the same task in six hours, the task would cost $72, providing a savings of $8. You might also be able to assign tools or equipment to the task, and thereby increase the efficiency of the labor so that reduced hours of work result in reduced total labor costs. Comparing Project Versions A useful feature in Project 2003 allows you to compare the differences between your first draft of the project and a revised version. Analyzing the differences between duration, date, cost, and other values allows you to pinpoint and report the net effect of such changes. After completing a first version, you can use File, Save As to set the stage for the comparison process. To compare versions, follow these steps: -
After completing and saving your first version (Version 1), create a second version (Version 2) by selecting the File, Save As command. -
Make necessary revisions and Save Version 2. -
Open Version 1, which should have closed when you created Version 2, and then reactivate Version 2 through the Window menu. NOTE It is recommended that you run Compare Project Versions from Version 2 as this will automatically position Version 2 as the later version in the Compare Project Versions dialog box. -
Apply the Compare Project Versions toolbar by selecting View, Toolbars, Compare Project Versions. The toolbar is shown in Figure 12.11. Figure 12.11. The Compare Project Versions toolbar allows you to navigate to tasks and resources and apply filters and tables.  CAUTION When you choose File, Save As for a project that shares resources from a resource pool, you end up with Version 1 and Version 2 linked to the pool causing duplication of assignment information and falsifying availability information. After you have compared versions, you should select the version you plan to discard and break its link to the resource pool. To learn more about breaking a link to a resource pool, see "Sharing Resources Among Projects," p. 621.
-
 | Click the Compare Project Versions button to open the Compare Project Versions dialog box as shown in Figure 12.12. | Figure 12.12. You can compare versions and select tables from the Compare Project Versions dialog box. 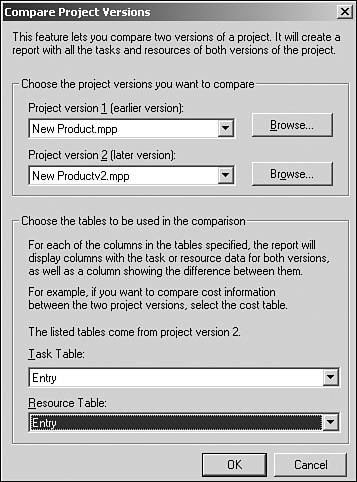 -
Select an appropriate task table and resource table in the (Choose the tables to be used in the comparison) section, and then click OK. -
In the Compare Project Versions Done dialog box, click Yes to view the Compare Project Versions legend or No to immediately begin viewing differences between versions in the Comparison Report project plan as shown in Figure 12.13. Figure 12.13. A custom table and Gantt bars represent Version 1 and Version 2 in the Comparison Report project. 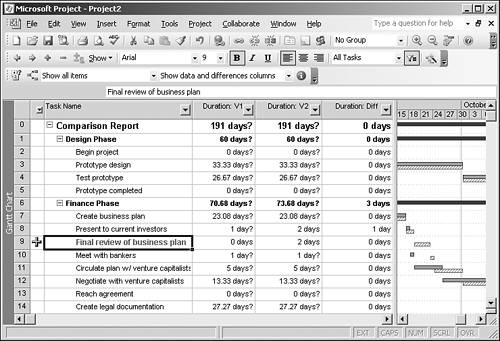  | If you try to compare cost information by using compare versions, but not all the information shows up in the comparison project, see "Compare Version's Use of User -Defined Fields" in the "Troubleshooting" section near the end of this chapter. |
In the Comparison Report project, a custom table is applied to the task sheet. The Comparison Report table includes three custom fields for each field from the table selected in Version 2. For example, there are three Duration fields in the comparison plan task table, based on the Duration field being present in the Entry table in Version 2. In the preceding steps, the Entry table is selected for both tasks and resources. Table 12.4 includes custom field labels, actual field names , and respective version and data type based on the Task Entry table from Version 2. Table 12.4. The Comparison Report: Task All Columns Table Utilizes Several User-Defined Fields | Field Label | (Actual Field Name ) | Version: Data Type | | Duration: V1 | (Duration1) | Version 1: Duration | | Duration: V2 | (Duration2) | Version 2: Duration | | Duration: Diff | (Duration3) | Comparison version: Duration | | Start: V1 | (Start1) | Version 1: Date | | Start: V2 | (Start2) | Version 2: Date | | Start: Diff | (Duration4) | Comparison version: Duration | | Finish: V1 | (Finish1) | Version 1: Date | | Finish: V2 | (Finish2) | Version 2: Date | | Finish: Diff | (Duration5) | Comparison version: Duration | | Predecessors: V1 | (Text1) | Version 1: Text | | Predecessors: V2 | (Text2) | Version 2: Text | | Predecessors: Diff | (Text3) | Comparison version: Text | | Resource Names: V1 | (Text4) | Version 1: Text | | Resource Names: V2 | (Text5) | Version 2: Text | | Resource Names: Diff | (Text6) | Comparison version: Text |  | Click the More Information button on the Compare Project Versions toolbar to review the legend for the schedule, task and resource list, and filter and table definitions. | There are a couple issues to be aware of in regard to the Compare Project Versions feature: -
Compare Project might not have enough custom fields available to display all the data. The Compare Project Versions tool warns you when you have too many user-defined fields, as shown in Figure 12.14. Figure 12.14. A currently selected table includes too many fields for comparison purposes.  -
User-defined fields will remain intact. The Comparison Report project utilizes its own set of custom fields. The Comparison Report project does not change your custom fields. If your custom fields are listed in the table that the comparison report is run against, version values and differences are listed the same way as for the Duration and Cost fields. |