Looking at the Big Picture
| < Day Day Up > |
| After you create a first draft of a project, it is a good idea to carefully review all project, task, resource, and assignment information. After Project calculates the schedule and costs of the project, you need to step back from the details and look at the big picture. Does it make sense? How successfully has the project plan met the overall objectives? Is the project going to finish on time? Are costs within budget? Often, the first draft of a project includes missed deadlines, costs that have exceeded the project budget, and other inconsistencies. After Project has calculated the schedule, a task's finish date might now be scheduled five business days after an internally imposed deadline, and the total cost for the project might be in excess of $5,000 over the contractually approved budget. This chapter describes tools for evaluating the overall project against the objectives laid forth in the project initiation and planning processes. Microsoft Project offers many tools to make this evaluation easy. The following are some of the things you can do to review a project plan:
You might feel overwhelmed by the multitude of details in a large project. From time to time, you might need to step back and look at the overall project to keep a global perspective. You can begin by reviewing Project statistics to compare values against project objectives. You can then compress the timescale to review the project from a macro perspective, and collapse the task outline to view major phases of the project.
Reviewing Project-Level Statistics
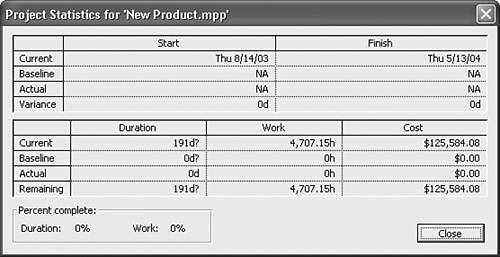
Figure 12.1. You can use the Project Statistics dialog box to review project summary information. You can use the Project Statistics dialog box to review project summary information. After you start work on the project and enter tracking information, the Actual Start, Start and Finish Date Variance, Actual and Remaining Duration, Work, and Cost values are also displayed. NOTE Notice that all baseline information in Figure 12.1 appears as NA. Chapter 14, "Tracking Work on a Project," describes how to capture and update the project baseline, which causes these fields to be populated . Compressing the TimescaleYou can usually gain an overview of the flow of activity in a project by viewing the Gantt Chart view with the timescale compressed. In Figure 12.2, for example, a project is displayed with the timescale compressed to show years in the top tier, months in the middle tier, and weeks in the bottom tier . (For clarity, a custom Gantt Chart view is displayed in which resource names and dependency arrows have been removed from the Gantt Chart). Figure 12.2. You can compress the timescale to get an overall view of the time dimension of a project.
TIP You can double-click any part of the timescale tiers to access the Timescale dialog box, where you can customize the appearance and values of each tier. To display all three tiers of the timescale, click the Top Tier tab, and in the Timescale options section, open the Show drop-down list and choose Three Tiers (Top, Middle, Bottom). Collapsing the Task List Outline
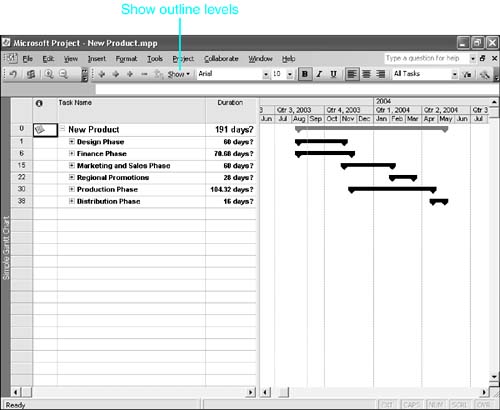
Figure 12.3. You can hide the subtasks in an outlined project to focus on the major phases of the project. To collapse the outline to the first level, activate a pane that displays a task list table (for example, the Gantt Chart view), and then Click the Show button on the Formatting toolbar and choose Outline Level 1 from the list that appears.
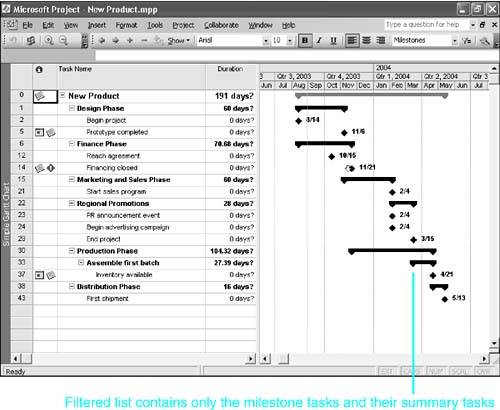
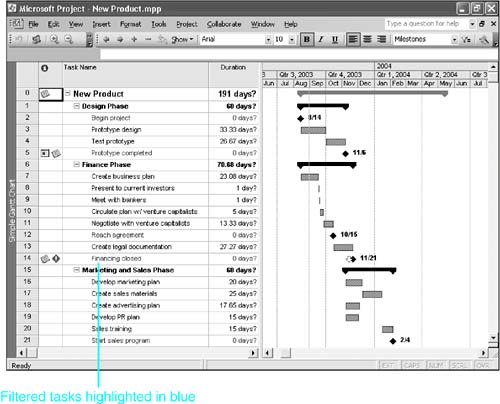
Using Custom WBS Code FormatsIt is also important to analyze the Work Breakdown Structure to ensure that the project contains the proper level of detail. WBS codes in Project are calculated for each task, or may be manually entered if corporate methodologies call for custom WBS codes. The WBS format allows numbers , letters , and characters , which can be very useful when reviewing tasks based on custom corporate codes. To see the WBS codes that are currently being used in a project, you may temporarily insert the WBS field in a task table that's part of a task view, such as the Entry table in the Gantt Chart view. You can create custom WBS codes by selecting Project, WBS, Define Code to designate the WBS format. Using Custom Outline CodesThere might also be internal codes that would help you to ensure that the structure of your plan is correct. When you need to apply a custom code to a task or resource, such as an internal accounting code or a predesignated organizational code, you can use Outline Code fields instead of Project's WBS field. Ten Outline Code fields are available for use. These fields enable you to apply your own codes to tasks or resources. The Outline Code fields provide a drop-down list from which users can look up and select authorized codes. By limiting codes to a predefined list, you prevent errors that inadvertently arise when codes are manually typed in. You can also change the displayed field name to reflect the actual name you want to use for a custom code. Filtering the Task or Resource ListWhen reviewing the content and structure of a plan, you might want to filter for specific task and/or resource information. When you filter the task list, you impose conditions that must be met in order to display a task. All tasks that meet the conditions are displayed and are known as filtered tasks , and all tasks that fail to meet the conditions are not displayed. You can apply filters, for example, to display critical tasks or milestones as shown in Figure 12.4. Figure 12.4. A filtered task list that shows only milestones lets you focus solely on important completion dates. You can also use a highlight filter, which displays all tasks, whether they meet filter conditions or not. The names of the tasks that meet the conditions are shown in blue, and the names of the tasks that do not meet the filter conditions are shown in black (see Figure 12.5). To apply a highlight filter, select Project, Filtered For, More Filters; select the name of the filter you wish to apply; and then click Highlight in the More Filters dialog box. You can use the Text Styles dialog box (which you open by selecting Format, Text Styles) to alter the color of highlighted tasks. You can also use filters in resource views to display specific resources. Figure 12.5. Having filtered tasks appear highlighted makes them stand out in the display. NOTE The summary tasks for filtered tasks are displayed based on a setting in the Filter Definition dialog box. If you don't want to display summary tasks for a particular filter, select Project, Filtered For, More Filters; select the appropriate filter; click the Edit button; and then clear the Show Related Summary Rows check box. Microsoft Project provides many predefined filters, a few of which are interactive. A standard filter displays values that meet filter conditions immediately, while interactive filters prompt the user for values against which to apply conditions. The Date Range filter, for example, prompts you for two date values: the beginning and ending dates for the date range. Project then displays all tasks whose schedule includes dates that fall within the user -defined dates. Table 12.1 lists recommended predefined Project filters for reviewing a project. Table 12.1. Predefined Task Filters for Reviewing a Project
TIP The Summary Tasks filter is not usually a good substitute for collapsing the task outline, as the filter only displays summary tasks. If you are attempting to view the highest level summary tasks in your project, you may be better served by selecting Outline Level 1 from the Show button on the Formatting toolbar. Furthermore, if any first-level task in the outline is not a summary task, the task is not included in the filtered list of tasks. If you want to focus only on the tasks up to a certain level in the outline, collapsing the entire outline to that level of tasks is a preferred method. When your review of filtered tasks is complete, you may return to viewing all tasks by pressing F3 or by applying the All Tasks filter. CAUTION If you edit tasks or resources while a filter is applied, you might change an element of a task or resource that affects whether the task continues to meet current filter conditions. If you make changes, you must reapply the filter to make the filtered display accurate. For example, suppose you apply the Tasks with Deadlines filter to display only tasks with deadlines. If you then remove a deadline from one task, the filter does not automatically refresh and remove that edited task from the filtered list. You can use Ctrl+F3 to reapply (refresh) the current filter. One of the most useful filters is the Tasks with Fixed Dates filter. You use this filter to identify all tasks that have constrained dates. Users often inadvertently place constraints on tasks and then don't understand why Project doesn't recalculate start and finish dates as expected. The Tasks with Fixed Dates filter allows you to review constrained tasks and be certain that the constraints are in fact necessary.
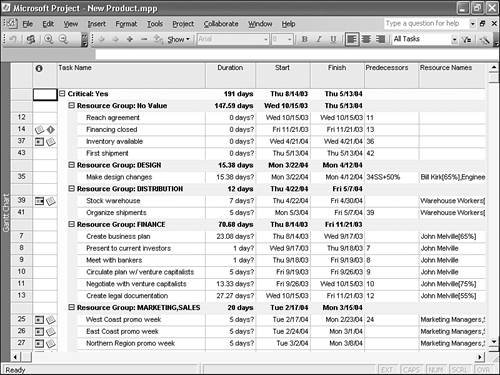
Sorting and Grouping Project DataYou can reorganize a list of tasks or resources in a project to better visualize certain aspects by sorting or grouping data. Sorting involves reorganizing rows of information. You can design a sort that uses up to three fields to sort by. For example, by using a single-field sort , you could order the resource list by resource name (the Name field) to come up with an alphabetical list of resources. Or, you could use a multi-field sort to order the resource list first by group , to display everyone from a particular department together, and then by name. Grouping , on the other hand, can both sort and summarize a list of tasks or resources. With this powerful feature, you can designate the groups you want to create. For example, you can group a task list by critical and noncritical tasks and then group the list by resource group as shown in Figure 12.6. The critical tasks are listed first, grouped by resource group. You simply scroll to see the noncritical tasks and the resource groups associated with those tasks. Figure 12.6. The grouping feature allows you to select from several formatting options to alter the appearance of grouped data. Sorting Task and Resource ListsWhen you sort an outlined project, you can retain or ignore the outline structure. If you retain the outline structure, all tasks at Outline Level 1 are sorted (carrying their subtasks with them); then, within each summary task, all subtasks at the next outline level are sorted (carrying their subtasks with them), and so forth. If you choose not to keep the outline structure, subtask groups are broken up and dispersed throughout the task list independently of their summary tasks. If you do not keep the outline structure, you might consider suppressing the display of summary tasks and the indentation of subtasks. To sort tasks or resources, choose Project, Sort, Sort By to access the Sort dialog box (see Figure 12.7). Figure 12.7. You can change the default settings in the Sort dialog box.
If you are sorting a list of tasks, you might want to hide the display of summary tasks and remove the indentation from the display of subtasks. To do so, complete the following steps:
If you edit a list that has been sorted, the list doesn't automatically re-sort based on recent changes. To sort the list again using the current sort keys, press Ctrl+Shift+F3 or activate the Sort dialog box. The sort keys are still defined as you last set them so you can simply click the Sort button to reapply the sort. To reset the list to normal order (by ID number), press Shift+F3, or access the Sort dialog box and click the Reset button and then click the Sort button. Grouping the Task and Resource ListsGrouping lets you reorder and summarize a task or resource list to better assess your project. When you organize the list into groups, the individual data for each item in that group is rolled up into totals for the entire group. Grouping project data is an excellent way to generate summary information that would otherwise be difficult to ascertain.
Table 12.2. Predefined Task Groups for Reviewing a Project
Table 12.3. Predefined Resource Groups for Reviewing a Project
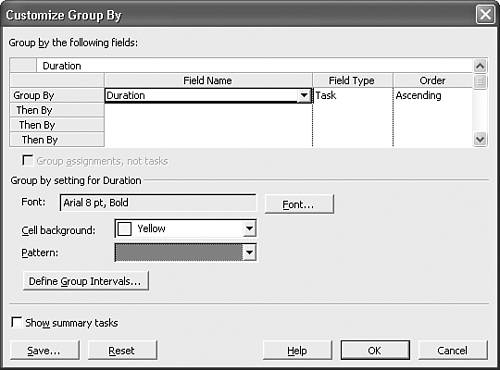
Customizing GroupsIn addition to using predefined groups, you can customize existing groups or create new groups. There are two ways to customize existing groups:
NOTE Like other new items you create, such as tables and filters, new groups you create are a part of the active project only. If you want to use a new group in another project file, you can copy the new group to the other project through the Organizer. If you want to make it available to all project files, you can use the Organizer to copy the new group in to the Global template file. Refer to Chapter 4, "Managing Project Files," for more information on using the Organizer and the Global template. To delete a custom group, you must use the Organizer.
|
 To establish a baseline for a project,
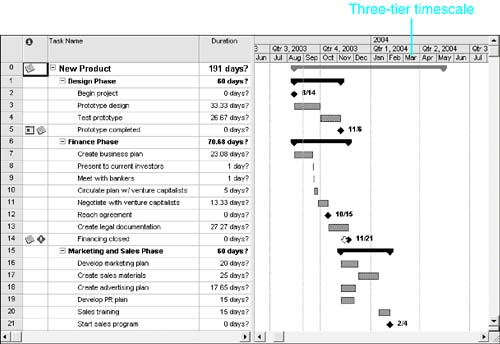
| < Day Day Up > |
EAN: 2147483647
Pages: 283