Tuning the Core Server Performance: The Thread Pool
| WebLogic Server is a Java-based multithreaded application server. The processing tasks of WebLogic Server are conducted in parallel by multiple threads known as execute threads inside WebLogic Server's thread pool . By default, WebLogic Server allocates 15 execute threads to the thread pool, which, for most application scenarios, is a sufficient thread count. A percentage of these execute threads (the default is 33%) is reserved for socket-reading purposes, and they are appropriately known as socket reader threads . These socket reader threads read inbound work requests from sockets and dispatch them to an appropriate execute queue . The remaining percentage of the execute threads performs the actual processing work inside WebLogic Server; hence, these threads are termed worker threads . Worker threads pick up work requests from the execute queue and process them. As a WebLogic Server administrator, you are responsible for finding the optimum balance between the number of execute threads you configure as socket reader threads and those you configure as worker threads inside the WebLogic Server thread pool. Note The terms execute threads and worker threads can be used interchangeably to denote threads in WebLogic Server where work requests are executed. The Socket Reader Implementation in WebLogic ServerWebLogic Server provides two types of socket reader implementations :
For optimum socket reader performance, you should use the native socket readers. WebLogic Server comes bundled with a platform-specific performance pack, which allows the native socket readers to make use of platform-specific asynchronous system calls to read data. The Java-based socket reader implementation is synchronous and can be slow. Note Performance packs use a platform-optimized, native socket multiplexor to improve server performance. You can use native socket readers with all the primary platforms supported by WebLogic Serverfor example, Windows, Solaris, HPUX, Linux, and AIX. On platforms where the performance pack is not available, you must use the Java-based socket reader implementation, which is discussed in detail later in the "Tuning the Java Socket Reader Threads" section. You can verify if a performance pack is available for your hardware platform on the Certifications pages of the BEA documentation at the following URL: http://e-docs.bea.com/wls/certifications/certifications/index.html Even though the performance pack is enabled by default for those platforms that support the native socket multiplexor, as a WebLogic Server administrator, you should always ensure that the performance pack is enabled by following these steps:
The performance pack binary ( wlntio.dll file on Windows, a libmuxer.so or libmuxer.sl file depending on the flavor of Unix) should be in your WebLogic Server's PATH . Depending on the platform on which you are running WebLogic Server, the binary is set appropriately in the setWLSEnv.sh script on Unix platforms and setWLSEnv.cmd on the Windows platform. This script is present in the $WL_HOME/server/bin directory of your WebLogic server installation. With the Native IO option enabled, you will notice the following log statements in your WebLogic Server's log file. For Windows: <Dec 5, 2002 11:58:02 PM PST> <Info> <socket> <000406> <NTSocketMuxer was built on Jun 24 2002 17:35:19> <Dec 5, 2002 11:58:02 PM PST> < Info > <socket> <000408> <Allocating 2 NT reader threads> For Unix <Nov 7, 2002 10:49:39 AM CST> <Info> <Posix Performance Pack> <devsun2> <adminserver> <ListenThread> <system> <> <000000> <System has file descriptor limits of - soft: '1024', hard: '1024'> ####<Nov 7, 2002 10:49:39 AM CST> <Info> <Posix Performance Pack> <devsun2> <adminserver> <ListenThread> <system> <> <000000> <Using effective file descriptor limit of: '1024' open sockets/files.> ####<Nov 7, 2002 10:49:39 AM CST> <Info> <Posix Performance Pack> <devsun2> <adminserver> <ListenThread> <system> <> <000000> <Allocating: '3' POSIX reader threads> Hence, by default, when you use the performance pack on the Windows platform, the number of socket reader threads is twice the number of CPUs on that specific server machine. On a Unix platform, the number of socket reader threads is set to 3 by default. WebLogic clients do not have performance packs and have to rely on the Java socket multiplexor implementation to read data. The following section discusses how you can tune the threads using the Java socket multiplexor implementation. Tuning the Java Socket Reader ThreadsWhenever possible, it is recommended that you use the performance pack provided while running any WebLogic Server instance. This makes for a very efficient native implementation of the socket multiplexor as compared to the pure-Java implementation. In cases when this is not possible, you have to use the Java socket reader implementation, and configuring the appropriate number of socket reader threads for each WebLogic Server instance and client will improve performance. The socket reader threads are a part of the default execute queue. The ThreadPoolPercentSocketReaders attribute of the ServerMBean allows you to set the percentage of execute threads from the default queue that will be used for socket reading. The default value for this attribute is 33 (percent) and the range of legal values is 199. Increasing the value of the ThreadPoolPercentSocketReaders attribute will improve the socket-reading performance of the server because there will be a greater number of execute threads dedicated to socket reading. However, because the socket reader threads are a part of the default execute queue, increasing this value cuts down on the number of threads available for actually executing the tasks. The value you assign to the ThreadPoolPercentSocketReaders attribute depends on your application type. For example:
To set the number of socket reader threads for WebLogic Server, follow these steps:
Note Setting the Socket Readers attribute on the server makes sense only when you are using the pure-Java socket multiplexor implementation for your WebLogic Server. On the client side, you cannot use the performance pack, so you must default to the Java socket multiplexor implementation. If your client is I/O intensive, making several remote calls, then increasing the socket reader count on the client side will improve performance. On the client side, you can do this by setting the value of the ThreadPoolPercentSocketReaders system property. You can also increase the total number of execute threads available on the client side by setting the value of the ThreadPoolSize system property. You can configure the number of socket reader threads on the client side by specifying the following options in the Java command line for the client:
WebLogic Server Execute QueuesAs mentioned earlier in this chapter, WebLogic Server is a multithreaded application server. The server maintains a pool of Java threads that do all the work. Using multiple threads allows the tasks to be executed in parallel and achieve high performance. These threads in WebLogic Server are called execute threads (or worker threads) because the tasks are executed by them. The threads within WebLogic Server are partitioned into a set of queues called execute queues . Each queue has the responsibility of executing a specific type of task. The tasks can be application specific such as handling servlet/JSP requests, executing remote EJB methods , and establishing JDBC connections, or they can be server specific tasks such as handling Administration Console requests, handling transaction triggers, running dynamic garbage collection, handling replication requests, and so on. The execute threads are partitioned into execute queues so that one particular task does not take over all the thread resources and cause thread starvation for other types of tasks. Examples of some of the execute queues in WebLogic Server include
As shown in Figure 28.2, work requests enter WebLogic Server through either the listen thread (listens on port 7001 by default) or the SSL listen thread (listens on port 7002 by default), depending on the protocol used for sending the request. These requests are read by the socket reader threads and then placed on an appropriate execute queue depending on the request type. If no custom execute queues are configured, the requests are placed on the default execute queue. Figure 28.2. The internals of the WebLogic Server thread pool. Note WebLogic Server also allows you to configure custom execute queues on a per-application basis. These queues are discussed later in this chapter in the "Assigning Applications to Specific Execute Queues" section. As execute threads (worker threads) within the specific queue become free, they pick up the requests from the execute queue, execute the task, and send back the response. Determining the Appropriate Thread Count for an Execute QueueWebLogic Server allows you to tune the number of execute threads (worker threads) within the default execute queue. You will need to tune this number if you want to control the degree of concurrency/parallelism possible within the serverfor example, the number of simultaneous operations performed by the applications deployed on WebLogic Server. However, increasing this number does not necessarily guarantee better performance because more threads mean more context switching between threads and more memory usage, which could lead to a drop in performance. Caution Increasing the number of execute threads within the default execute queue inappropriately may degrade performance; therefore, you should be very careful while tuning the execute threads. The optimum number of execute threads in your WebLogic Server's default execute queue, from which you can derive performance value, is influenced by the following factors:
Taking into account these factors, the following sections describe how to tune your WebLogic Server's execute thread count in the default execute queue. Step 1: Start the Administration ServerStart your Administration Server. If you are not running the Administration Server in standalone mode, start the managed server(s) where your application(s) is deployed. By default, your WebLogic Server(s) will start with a default thread count of 15. Step 2: Run and Monitor a Load Test Against Your WebLogic Server ApplicationTo determine the ideal thread count for your default execute queue, you must run a load test against your WebLogic Server application and monitor the factors that can influence the queue's performance, which were mentioned earlier (throughput, response time, queue length, idle threads, CPU usage, and memory usage). This load test must simulate the important functional areas of your application operating at peak usage, which should include access to Enterprise Information Systems, such as database and legacy systems. You can perform a load test using a variety of performance analysis tools, as listed in Table 28.1. For example, a very easy performance analysis tool to use is the Web Benchmark tool, which you can download for free from BEA's Dev2Dev Web site ( http://dev2dev.bea.com ). Load testing your WebLogic Server application using the Web Benchmark requires only a few configuration steps, as follows :
After you configure the Web Benchmark tool, you can run a load test against your WebLogic Server application using the following command-line syntax: java BenchClient < #threads> < host > < port > "< URI >" < #iterations > where
For example, the following Web Benchmark command will simulate 15 clients, each performing 5,000 requests to the full URL of http://EINSTEIN:7001/HelloWorldApp/MyServlet : java BenchClient 15 EINSTEIN 7001 "/HelloWorldApp/MyServlet" 5000 Note The Web Benchmark tool allows you to hit Web pages in your application with multiple threads and multiple iterations. However, it does not support the use of POST requests or session tracking. The output you get from running the Web Benchmark indicates the latency of each thread (client), listed from the shortest to the longest amount of time. The output of the Web Benchmark tool will be examined later in this section. To monitor your load test, you can again use a performance analysis tool with built-in monitoring capabilities, or you can use the Administration Console's monitoring capability, which should be sufficient for monitoring the influential performance tuning factors of the execute threads in the default execute queue. To monitor the WebLogic Server environment, in conjunction with your performance analysis tool, you can also use the following system performance tools:
To showcase how you can use the Web Benchmark tool in conjunction with the Administration Console to load test and monitor the factors that can influence the execute queue's performance, we'll use a very simple example that will simulate 15 clients, each performing 10,000 requests to a simple URL. You can adjust the syntax of the Web Benchmark tool command according to your own WebLogic Server application pages. Note With the evaluation version of WebLogic Server, the maximum number of clients you can concurrently simulate is 15. To monitor the load test using the Administration Console, follow these steps:
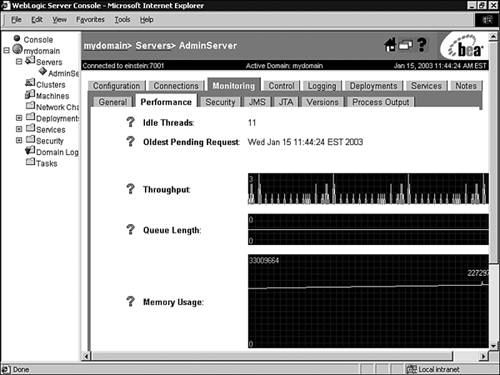
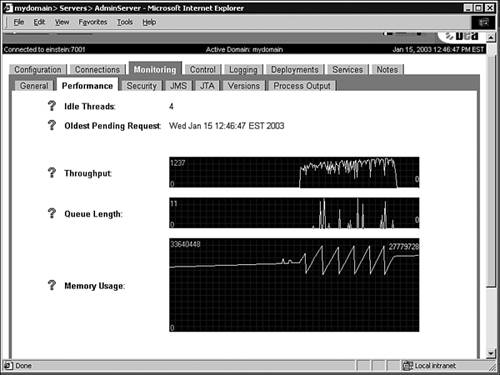
From the Performance tab of the Administration Console, as shown in Figure 28.3, you can monitor the following factors during the load test:
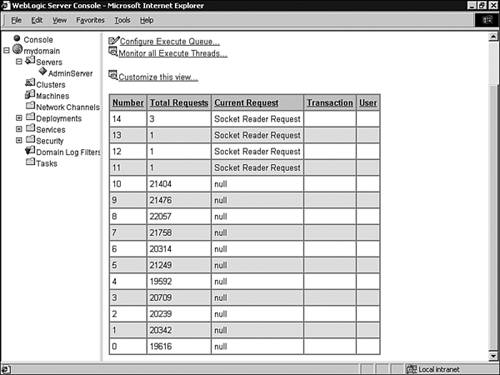
Tip You can adjust the refresh rate of the Administration Console and the polling interval ( milliseconds ) for graph data from the Console, Preferences tab. The polling interval will affect your displayed data because it will display the results based on your polling interval. To monitor the CPU utilization doing the load test, you can use either the Windows Performance Monitoring tool or an appropriate Unix utility, such as mpstat . Now that you know how to run and monitor a simple load test, the next step is to actually start the load testing and monitoring activities, which begins with running the Web Benchmark command. The command used for this simple showcase is java BenchClient 15 EINSTEIN 7001 "/HelloWorldApp/MyServlet" 10000 Note Because the purpose of this test is to simulate actual client interaction with WebLogic Server, it should be run from an actual client machine. As the Web Benchmark simulates your client load test, you can monitor the activity of your test via the Administration Console and other system monitoring tools. After the Web Benchmark completes its load test on your WebLogic Server application, it will display the results of the latency of the client requests to complete their iterations in the shortest to the longest time, as shown in Figure 28.4. Figure 28.4. The results of running the Web Benchmark tool in a simulated load test. The results from the Administration Console, as shown in Figure 28.5, also provide valuable information, as follows: Figure 28.5. The results of running the Web Benchmark tool through the Administration Console.
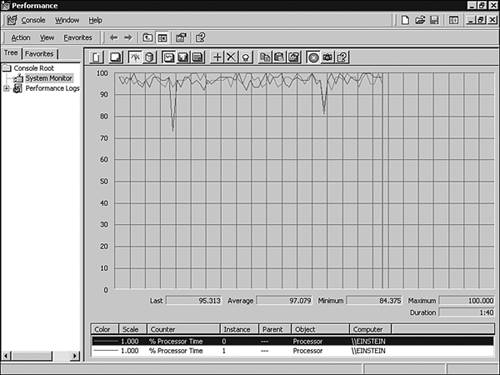
A Windows Performance Monitor tool also used during the load test indicated a maximum of 100% and a low of 84% CPU utilization on a dual CPU machine, as shown in Figure 28.6. Figure 28.6. The CPU utilization results of running the Web Benchmark tool through the Windows Performance Monitoring tool. You should perform your load test a number of times to a point where your results are relatively consistent, at which point you can analyze them. In general, if the thread count is set too low, you will see the following results from your load test:
In general, if the thread count is set too high, you will see the following results from your load test:
The hard and fast way to validate whether you are running your WebLogic Server with high or low thread count is to increase the thread count and compare your results. If there is an increase in performance, you need to repeat your tests by incrementing the thread count by a small amount (two to five threads only) until you reach a point where you see a performance degradation in the throughput and latency of the client requests. This will narrow your execute thread count to a small range for fine-tuning. The following section describes how you can modify the thread count in the default execute queue. However, if you increase your thread count and see an immediate performance degradation, you will have to take the same iterative test approach, but this time by decreasing the thread count by a small amount until you see a performance increase. This will also narrow your execute thread count to a small range for fine tuning. Step 3: Modifying the Thread Count in the Default Execute QueueYou can modify the number of execute threads in the default execute queue using the ThreadCount attribute of the ServerMBean. To set this attribute via the Administration Console, follow these steps:
Tuning Execute Queues for Overflow ConditionsThe socket reader threads in WebLogic Server read requests and place them on the appropriate execute queue. The length of this execute queue will increase if the requests come in at a rate faster than they are processed. In such situations, the response time for the requests will be slower. WebLogic Server allows you to configure attributes for the execute queue, which helps in detecting such conditions. The server detects an overflow condition if the length of the execute queue reaches a user-defined percentage of its maximum size. When this threshold is reached, the server's state is changed to Warning, and depending on other attributes set for the queue, additional execute threads can be allocated to the queue. These additional execute threads then pick up the requests from the execute queue and thus help in reducing the queue length to an acceptable limit. To detect the overflow conditions and handle them automatically, follow these steps:
The server prints the following message in the log file when it detects an overflow condition and adds ThreadsIncrease number of threads to the execute queue: <Dec 5, 2002 4:59:08 PM PST> <Warning> <WebLogicServer> <000333> <Queue usage is greater than QueueLengthThresholdPercent "5%" of the maximum queue size. We will try to allocate ThreadsIncrease "2" thread(s) to help.> Determining Stuck ThreadsWhen tasks are put on an execute queue by the socket reader threads, the idle execute threads pick up the task, execute it, and send back the response. Idle execute threads should always be available within the execute queue to perform this task. If no idle threads are available, the tasks will not be performed. This is a critical condition because the requests will go unserved. WebLogic Server automatically detects conditions in which an execute thread takes more than an acceptable amount of time to complete its task. The server marks such threads as stuck . If all the threads within an execute queue become stuck, the server changes its state to Critical or Warning, depending on the execute queue type. The server's health state changes to Critical if all the threads in the "default" queue are determined to be stuck. The server's health changes to Warning if all the threads in the weblogic_admin_html_queue , weblogic_admin_rmi_queue , or a user-defined execute queue become stuck. Note If a WebLogic Server's health state changes to Critical, it is very likely the server's health state will be labeled "failed," at which point if you are using the Node Manager, it can be used to shut down and restart the "failed" WebLogic Server. However, a change of health state to Warning does not necessarily imply WebLogic Server will be labeled "failed." To configure the detection of stuck threads in the server, follow these steps:
You can verify whether your WebLogic Server is detecting stuck threads by reviewing your WebLogic Server log file. For example, the server prints the following message in the log file when it detects a stuck thread: <Dec 5, 2002 4:56:52 PM PST> <Warning> <WebLogicServer> <000337> <ExecuteThread: '10' for queue: 'default' has been busy for "38" seconds working on the request "Http Request: /sleep.jsp", which is more than the configured time (StuckThreadMaxTime) of "30" seconds.> WebLogic Server also prints the following message in the log file when a thread marked Stuck by the server completes its work and becomes idle: <Dec 5, 2002 7:50:48 PM PST> <Info> <WebLogicServer> <000339> <ExecuteThread: '27' for queue: 'default' has become "unstuck".> Configuring Custom Execute QueuesWebLogic Server has a default queue to handle all the application-specific requests. However, it also allows you to configure execute queues on a per-application basis. You may want to configure these additional execute queues to achieve the following advantages:
You need to be aware, however, that unnecessarily configuring custom execute queues for applications wastes resources. You can have a condition in which execute threads in a particular custom queue are idle, while there are no idle threads in another application-specific execute queue. In this case, the idle threads in one queue are wasted resources because they could have been used by the other application if the queues were not partitioned. To configure custom execute queues using the Administration Console, follow these steps:
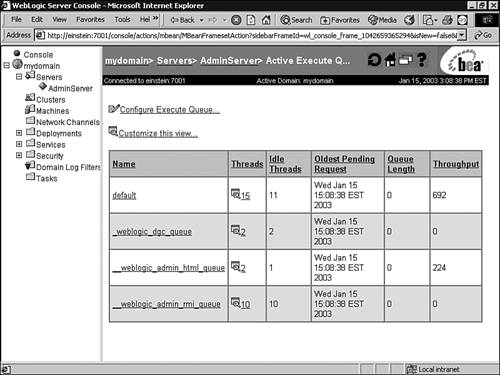
Assigning Applications to Specific Execute QueuesIn the previous section, we discussed the advantages of assigning dedicated execute queues to applications. In this section, we will discuss how applications such as servlets, JSPs, and EJBs can be assigned to dedicated execute queues. Assigning Servlets and JSPs to Execute QueuesTo assign servlets and JSPs to a dedicated execute queue that has been already configured in the server, you can use the <wl-dispatch-policy> parameter to specify the queue in which the servlet or JSP will be executed. This parameter is specified as an initialization parameter in the web.xml deployment descriptor of the Web application containing the servlets and JSPs. The following snippet from the web.xml file assigns a dedicated execute queue called CriticalAppQueue to the SnoopServlet and the critical.jsp file. Any requests for these Web files will be executed by threads within the CriticalAppQueue : <servlet> <servlet-name>SnoopServlet</servlet-name> <jsp-file>/myapp/critical.jsp</jsp-file> <init-param> <param-name>wl-dispatch-policy</param-name> <param-value>CriticalAppQueue</param-value> </init-param> </servlet> Assigning RMI Objects and EJBs to Execute QueuesTo assign an RMI object or EJB to a dedicated execute queue that has already been configured in the server, you can use the -dispatchpolicy option while using the rmic and ejbc compilers. Use the rmic compiler as follows: java weblogic.rmic -dispatchPolicy CriticalAppQueue examples.HelloImpl If the RMI implementation class is compiled as shown, any requests for the HelloImpl remote object will be executed on the server in an execute thread from the CriticalAppQueue . Use the ejbc compiler as follows: java weblogic.ejbc -dispatchPolicy CriticalAppQueue std_AccountBean.jar AccountBean.jar If the EJB AccountBean is compiled as shown, any requests for the remote methods of the AccountBean will be executed on the server in an execute thread from the CriticalAppQueue . Monitoring Execute Queues and Execute ThreadsTo monitor the execute queues, execute threads, and their attributes in WebLogic Server, follow these steps:
Tuning the Connection BacklogThe AcceptBackLog parameter allows you to configure the number of TCP connection requests that can be buffered in a wait queue before being accepted by the server. WebLogic Server, by default, listens on two ports: the plain-text port (default 7001) and the SSL port (default 7002). If work requests come to these ports at a rate faster than they are being processed, they will be buffered in a queue whose size is fixed by this parameter. You will need to tune this parameter if either the connections are being dropped silently on the client side or the clients are receiving connection refused messages when trying to connect to WebLogic Server. The default value of this parameter is 50, which means that a maximum of 50 connection requests can be buffered at any given time. If the queue becomes full, additional connection requests will be dropped and not accepted by the server. Caution Setting this parameter to 0 may prevent the server from accepting any connections on some operating systems. To set this parameter, follow these steps:
To tune this parameter, start a realistic load test on the server. If you see connections being refused on the client side, increase the AcceptBackLog value by 25% and retest. Continue increasing the parameter by 25% until the queue size is large enough to buffer the connection requests generated by your load test. |
 For information on the use of socket readers in a WebLogic cluster,
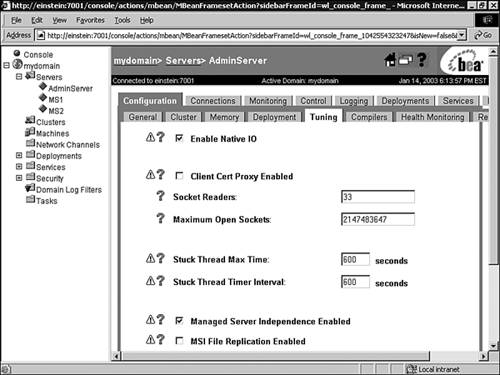
EAN: 2147483647
Pages: 360