22.5 Oracle Enterprise Manager and the Wait Event Interface
|
| < Day Day Up > |
|
Oracle Enterprise Manager is an excellent tool for drilling down visually into the Oracle Database Wait Event Interface. Spotlight is best for real-time monitoring of a busy production database since it places all the important monitoring information in one place. However, Oracle Enterprise Manager is more visually palatable and easier to use as a drill down tool. We now have a basic understanding of the underlying V$ performance views allowing access into Oracle Database Wait Event Interface statistics.
On that basis I have abandoned any deeper-layer drill-down into the Oracle Database Wait Event Interface using the Oracle Database V$ performance views because Oracle Enterprise Manager is so much easier to use in this respect. Why make it difficult?
Some of the visual aspects of Oracle Enterprise Manager have already been covered in two previous chapters of this book. It is assumed that you know how to execute the console and log into a Management Server to allow access and drill-down into the Oracle Database Wait Event Interface for a particular database.
| Tip | Use of the Management Server is not an absolute requirement but it does sometimes provide better functionality. |
What I am going to do is to connect to my very busy database in the console (logged in through a Management Server) and execute the Performance Overview option in the Diagnostics Pack under the Tools menu. Then I will see if there are any problems with my database. If there are I will drill down into those problem areas attempting to locate something I can tune.
Looking at the Database Memory portion in the Database Health Overview chart I notice something odd. The database buffer cache hit ratio is going up and down, vacillating between 60% and 90% as shown in Figure 22.8. Depending on the application this may not be a problem. However, since my application is mostly doing mostly very small transactions it seems a little odd.
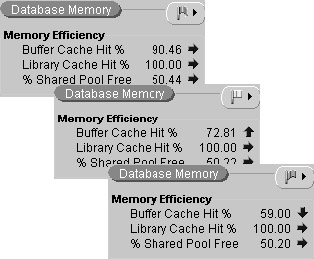
Figure 22.8: Database Health Overview Chart– Database Memory Portion
I am certainly not going to make my database buffer cache larger. Another clue is noticeable latch free wait events as well as scattered reads being much more prominent than sequential reads when the red flag is up as seen in Figure 22.9.
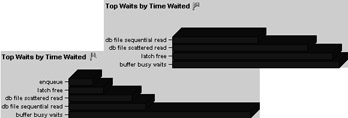
Figure 22.9: Database Health Overview Chart–Database Memory Portion
A large transaction is probably forcing highly used blocks out of the buffer; consequently those highly used blocks will probably be loaded back into the buffer. Let's drill down. Looking at Figure 22.10, I drill down into the "Top Objects by Physical Reads" and the "TopSQL (Physical Reads)". These two drill-downs tell me a lot. Note a number of points.
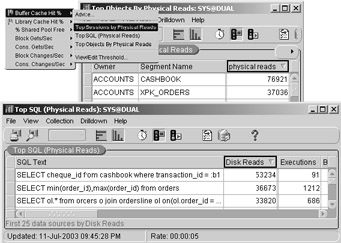
Figure 22.10: Top Objects and TopSQL
-
The Cashbook table is at the top of both database objects and SQL in terms of data reads.
-
The number of executions for the top SQL statement is relatively low.
-
The physical reads for the Cashbook table is double as compared with the next object down on the list, the Orders table primary key index.
-
The really obvious part is that the Cashbook table is shown as being heavily active. An index on the Cashbook table is not being used.
Examining Figure 22.10 a little further, do I know what to look for yet? Yes I do. The Cashbook table is probably being full table scanned when it should not be. Why? The SQL code statement on the Cashbook table has a WHERE clause against a foreign key index. I checked foreign key indexes on the Cashbook table. I found that the foreign key index on the Cashbook table TRANSACTION_ID column foreign key relation to the Transactions table was missing. The chances are I dropped the index in error sometime during the course of writing this book. Or it was never created. Let's create that index.
CREATE INDEX XFK_CB_TRANS ON cashbook(transaction_id) TABLESPACE INDX ONLINE;
I then drilled down into the TopSQL and Top Objects tools again and found that the Cashbook table was not even in the top 10 for both tools as was evident in Figure 22.10. The problem was solved.
Any type of wait event can be drilled down into to the lowest level of detail with a multitude of iterations of each tool using the Oracle Database Wait Event Interface, as implemented in the Oracle Enterprise Manager GUI. I would not recommend using the Oracle Database Wait Event Interface in any other way.
|
| < Day Day Up > |
|
EAN: 2147483647
Pages: 164