21.3 Operating System Tools
|
| < Day Day Up > |
|
21.3.1 Windows Performance Monitor
The Windows Performance Monitor is useful for monitoring operating system-level performance. The GUI can be started up on a Windows 2K server in the Administrative Tools icon on the Control Panel. This tool allows graphical display of all aspects of hardware and operating system-level activity. Figure 21.15 shows a picture of a dual-CPU server displaying both processors, memory, and network activity for a relatively idle database server.
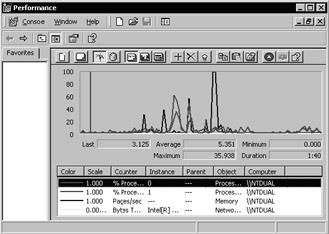
Figure 21.15: The Windows Performance Monitor
Figure 21.16 on the other hand shows the Windows Performance Monitor GUI for a highly active single-CPU system. The Windows Task Manager snapshot is added to show how busy this system was when these screenshots were taken.
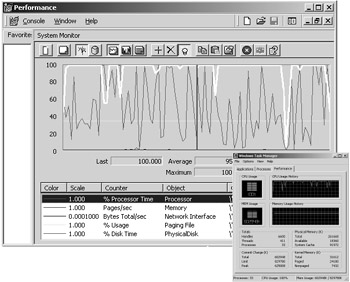
Figure 21.16: This is a Very Busy Server
There are a multitude of command line and GUI tools used for operating system monitoring and tuning in other operating systems such as Unix or Linux.
21.3.2 Unix Utilities
There are a plethora of tools used in all flavors of Unix and Linux operating systems, both command line utilities and GUI-based monitoring tools. These tools are some of the command line monitoring tools used on Solaris.
-
CPU Usage. sar, vmstat, mpstat, iostat.
-
Disk I/O Activity. sar, iostat.
-
Memory Usage. sar, vmstat.
-
Network Usage. netstat.
Since I am not an experienced systems administrator I see no point in attempting to explain the detailed syntax and use of these tools.
|
| < Day Day Up > |
|
EAN: 2147483647
Pages: 164