8.7 Transaction performance reporting
|
| < Day Day Up > |
|
8.7 Transaction performance reporting
Before presenting the various online reports available with IBM Tivoli Monitoring for Transaction Performance Version 5.2 using the data from the sample Trade application, you should review the general description of online reporting in Chapter 7, "Real-time reporting" on page 211.
As a reminder, you should remember that IBM Tivoli Monitoring for Transaction Performance Version 5.2 provides three types of reports:
-
Big boards
-
General reports
-
Components events
When working with the online reports, please keep the following in mind:
-
All the online reports are available from the home page of the TMTP Console. Use the navigation pane on the left to go to Reports, and select the main category of our interest.
-
To view the recent topology view for a specific QoS or J2EE enabled policy, go to the Big Board and click on the Topology icon of the transaction you are interested in.
-
To view the most recent data, you can click on the Retrieve Latest Data icon (the hard disk symbol) in order to force the Management Agent to upload the latest data to the Management Server for storage in the TMTP database.
-
In the topology views, you may change the filtering data type to Aggregate or Instance and Show subtransaction slower than.
-
To see a general report of every transaction/subtransaction, select General Reports→ Transaction with Subtransaction and use Change Settings to specify the particular policy for which you want see the details.
-
To see the STI playback policy topology view, select Topology from the General Reports. Now use Change setting on the STI playback policy you want to see details for and drill down to the created view to see STI, QoS, and J2EE transaction correlation using ARM. For a discussion of transaction drill down using ARM and correlation, please see 7.4, "Topology Report overview" on page 215.
-
There are four additional options from a topology node. Each of the following can be accessed using the context menu (right-click) of any object in the topology report:
Events View
View all the events for the policy and Management Agent.
Response Time View
View the node's performance over time.
Web Health Console
Launch the ITM Web Health Console for this Management Agent.
Thresholds View
Configure a threshold for this node.
8.7.1 Reporting on Trade
If we consider an end user who uses a trade application for buying and selling stock, the application probably uses several processes to buy and sell, such as:
-
Browse to Trade Web site
-
Log in to trade application
-
Quote/trade
-
Buying/selling
-
Log out from the application
The Trade application is running on a WebSphere Application Server Version 5.0.1 and we have configured a synthetic trade transaction with STI data to correlate J2EE components and Quality of Service, so we can figure out what is happening at the application server and database.
From the Big Board shown in Figure 8-46, we can see, because of our use of consistent naming standards, that the following active policies are related to the Trade application:
| trade_j2ee_lis | Listening policy for J2EE |
| trade_qos_lis | Listening policy for QoS |
| trace_2_stock-check | STI Playback policy |
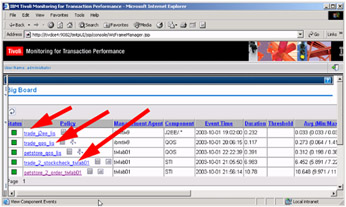
Figure 8-46: Event Graph- Topology view for Trade application
8.7.2 Looking at subtransactions
Now, to get a snapshot of the overall performance, we open the Transactions with Subtransactions report for the trace_2_stock-check policy. The overall and subtransaction times are depicted in Figure 8-47 on page 298.
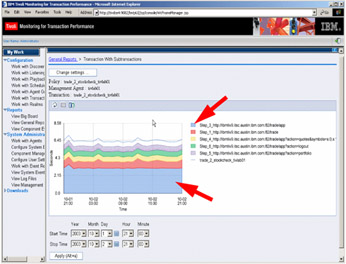
Figure 8-47: Trade transaction and subtransaction response time by STI
From the Transaction with Subtransaction report for the trace_2_stock-check, we see that the total User Experience Time to complete the order is 6.34 sec. This is measured by STI. We can drill down into the Trade application and see every subtransaction response time (maximum of five subtransactions) and understand how much time is used by every piece of the Trade business transaction.
Click on any subtransaction in the report, and it will drill down into the Back-End Service Time for the selected subtransaction. If this is repeated, TMTP will display the response times reported by the J2EE application components for the actual subtransaction. As an example, Figure 8-50 on page 301 shows the Back-End Service Time for the step_3 -- app -- subtransaction.
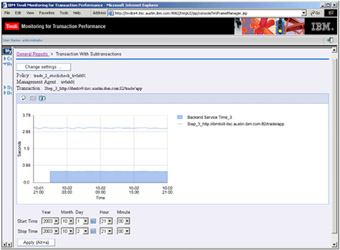
Figure 8-48: Back-End service Time for Trade subtransaction 3
The Back-End Service Time details for subtransaction 3 shows that the actual processing time was roughly one fourth of the overall time spent. When drilling further down into the Back-End Service TIme for subtransaction 3, we find, as shown in Figure 8-49 on page 300, that the servlet processing this request is:
com.ibm.websphere.samples.trade.web.OrdersAlertFilter.doFilter
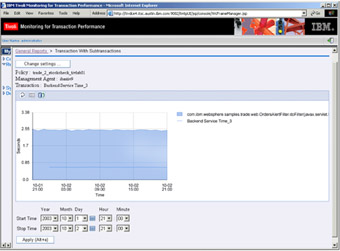
Figure 8-49: Time used by servlet to perform Trade back-end process
The drill down can basically go on and on until we have reached the lowest level in the subtransaction hierarchy.
8.7.3 Using topology reports
Another way of looking at the performance and responsiveness of the Trade application is to look at the topology. By drilling down into the QoS topology (by means of transactions and subtransactions, and using decomposing through relationships between parent- and child-transactions), we can find the real end-user response time, as shown in Figure 8-50 on page 301.
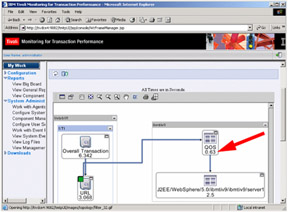
Figure 8-50: STI topology relationship with QoS and J2EE
Because STI, QoS, and J2EE are ARM instrumented and parent/child relationships are correlated, we can also see these transactional relationships in the Topology View.
The total real end-user response time is 0.623 seconds, and if we decompose the topology further, we see six specific back-end response times, one for each of the different Trade subtransactions/processes. From the Inspector View shown in Figure 8-51 on page 302, we can see the total end-user time, all subtransaction steps, Back-End Service Time, and J2EE application time from servlets, EJBs, and JSPs.
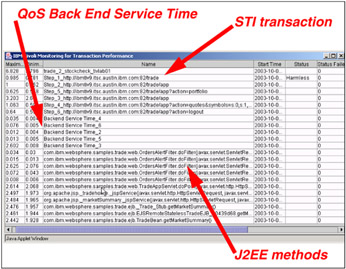
Figure 8-51: QoS Inspector View from topology correlation with STI and J2EE
However, so far, we have not analyzed how much time is spent in the WebSphere Application Server 5.0.1 application server and database, that is, the combined total for:
-
Trade EJB
-
Trade session EJB
-
Trade JSP pages
-
Trade JavaServlet
-
Trade JDBC
-
Trade database
Looking at the overall Trade application response time (shown in Figure 8-52), we can break down the application response time:
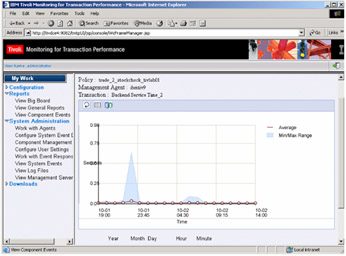
Figure 8-52: Response time view of QoS Back end service(1) time
-
EJB response time (see Figure 8-53 on page 304 and Figure 8-54 on page 305)
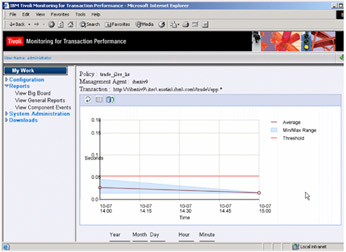
Figure 8-53: Response time view of Trade application relative to threshold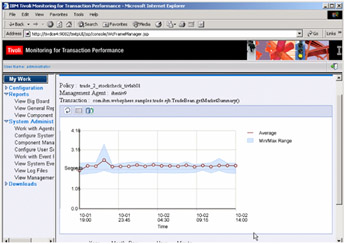
Figure 8-54: Trade EJB response time view get market summary() -
JSPpages response time
-
JDBC response time (see Figure 8-55 on page 306)
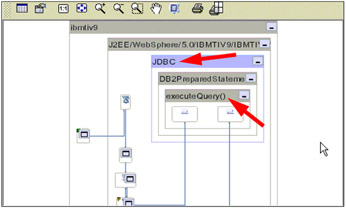
Figure 8-55: Topology view of J2EE and trade JDBC components
and drill down to its child methods or execution. In this way, we can find any bottleneck of the application server, database, or HTTP server by using different TMTP components, synthetic and real.
Figure 8-53 shows the overall Trade application response time relative to the defined threshold instead of the absolute times shown in Figure 8-52 on page 303.
When drilling down into the Trade application response times shown in Figure 8-53, we see the response times form the getMarketSummery() EJB (see Figure 8-54 on page 305).
Figure 8-55 on page 306 shows you how to drill all the way into a JDBC call to identify the database related bottlenecks on a per-statement basis.
For root cause analysis, we can combine the topology view (showing the e-business transaction/subtransaction and EJB, JDBC, and JSP methods with ITM events of different resource models like CPU, processor, database, Web, and Web application using the ITM Web Health Console. Ultimately, we can send the violation event to TEC. Figure 8-56 on page 307 shows you how to launch the ITM Health Console directly from the topology view.
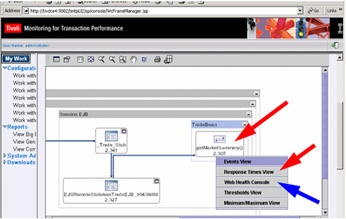
Figure 8-56: Topology view of J2EE details Trade EJB- get market summary()
|
| < Day Day Up > |
|
EAN: 2147483647
Pages: 105