2.3 Reporting and troubleshooting with TMTP WTP
|
| < Day Day Up > |
|
2.3 Reporting and troubleshooting with TMTP WTP
One of the strengths of this release of TMTP is its reporting capabilities. The following subsections introduce you to the various visual components and reports that can be gathered from TMTP and the way in which these could be used.
Troubleshooting transactions with the Topology view
Your organization has installed TMTP V5.2 and it has been configured to send e-mail to the TMTP Administrator as well as sending an event to the Tivoli Enterprise Console upon a transaction performance violation. Using the following steps, the TMTP administrator identifies and analyzes the transaction performance violation and ultimately identifies the root cause.
After receiving the notification from TMTP, the Administrator would log onto TMTP and access the "Big Board" view, shown in Figure 2-3.
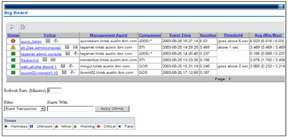
Figure 2-3: Big Board View
From the Big Board View, the administrator can see that the J2EE policy called "quick_listen" had a violation at 16:27. The user can also tell the policy had a threshold of "goes above 5 seconds", which was violated, as the value was 6.03 seconds.
The administrator can now click on the topology icon for that policy and load the most recent topology that TMTP has data for (see Figure 2-4).
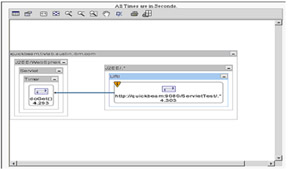
Figure 2-4: Topology view indicating problem
Since, by default, topologies are filtered to exclude any nodes that are slower than one second (this is configurable), the default view is to show the latest aggregated data for slow nodes. In Figure 2-4, you can see that there were only two slow performing nodes.
All nodes in the topology have a numeric value on them. If the node is a container for other nodes (for example, a Servlet node may contain four different Servlets) the time expressed on the node is the maximum time of what is contained within the node. This makes it easy to track down where the slow node resides. Once you have drilled down to the bottom level, the time on the base node indicates the actual time for that node (average for aggregate data, and specific timings for instance data). In Figure 2-4, the root node (J2EE/.*) has an icon that indicates that it has had performance violations for that hour.
The administrator can now select the node that is in violation and click on the Inspector icon. The Inspector view (Figure 2-5 on page 46) reveals that the threshold setting of "goes above 5 seconds" was violated nine times out of 11 for the hour and that the minimum time was 0.075 and the maximum time was 6.03. The administrator can conclude from these numbers that this nodes performance was fairly erratic.
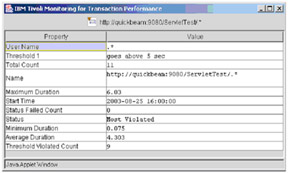
Figure 2-5: Inspector view
By examining the instance drop-down list (Figure 2-6), the administrator can see all of the instances captured for the hour.
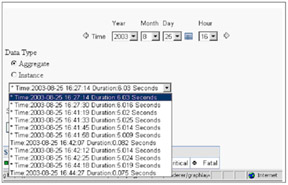
Figure 2-6: Instance drop down
Figure 2-6 on page 46 shows nine instances with asterisks indicating that they violated thresholds and two others with low performance figures indicating they did not violate. The administrator can now select the first instance that violated (they are in order of occurrence) and click the Apply button to obtain an instance topology (Figure 2-7).
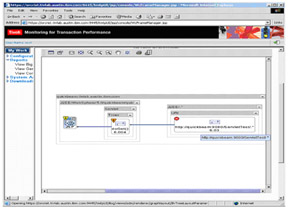
Figure 2-7: Instance topology
Again, this topology has the one second filtering turned on, so any extraneous nodes are filtered out. Here the administrator can see that, as suspected, the Timer.goGet() method is taking up a majority of the time, ruling out a problem with the root transaction.
The Timer.goGet() method has an upside down orange triangle indicating it has been deemed the most violated instance. This calculation is determined by comparing the instances duration (6.004 seconds in this case) to the average for the hour (4.303 seconds, as we saw above) while taking into account the number of times the method was called by that method. Doing this provides an estimate of the amount of time spent in a node that was above its average. This calculation provides an indication of abnormal behavior because it is slower than normal. Other slow performing nodes will be marked with a yellow upside down triangle, indicating a problem against the average for the hour (by default, 5% of the methods will have a marking).
Selecting the Timer.doGet() node and examining the inspector would show any metrics captured for the Servlet. In this example, the Servlet tracing is minimal, and the following figure is what would be displayed by the inspector (Figure 2-8). If greater tracing were specified, the context metrics could provide information on SQL statements, login information, and so on (some of the later chapters will demonstrate this), depending on the type of node selected and the level of tracing configured in the listening policy.
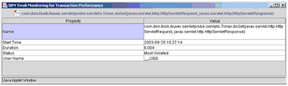
Figure 2-8: Inspector viewing metrics
Using these steps, the administrator has very quickly determined that the cause of the poor performance is a particular servlet, and the root cause is a specific method (Timer.doGet()) of that servlet. Narrowing the problem down this quickly to a component of an application would previously have taken a lot of time and effort, if it was ever discovered at all. Often, it is all just a little too hard to find the problem, and the temptation is to buy more hardware. This administrator has just saved his organization the expense of purchasing additional hardware because of a poorly performing servlet method.
Other reports provided with TMTP
Some of the other reports available from within TMTP are shown in this section.
Overall Transactions Over Time
This report (Figure 2-9 on page 49) can be used to investigate the performance of a monitored transaction over a specified period of time.
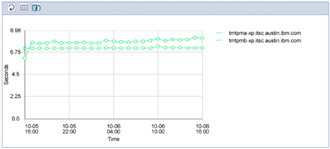
Figure 2-9: Overall Transactions Over Time
Transactions with Subtransactions
This report (Figure 2-10 on page 50) can be used to investigate the performance of a monitored transaction and up to five of its subtransactions over a specified period of time. A line with data points represents the aggregate response times collected for a specific transaction (URI or URI pattern) that is monitored by a specific monitoring policy running on a specific Management Agent. Colored areas below the line represent response times for up to five subtransactions of the monitored transaction. When a transaction is considered together with its subtransactions, as it is in this graph, it is often referred to as a parent transaction. Similarly, the subtransactions are referred to as children of the parent transaction.
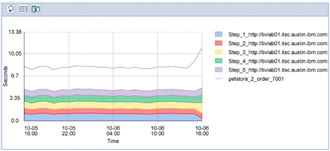
Figure 2-10: Transactions with Subtransactions
By default, when you open the Transactions With Subtransactions graph, the display shows the parent transaction with the highest recent aggregate response times. The default graph also shows the five subtransaction children with the highest response times. You can specify a different transaction for the display, and you can also specify any subtransactions of the specified transaction. In addition, you can manipulate graph contents in a variety of other ways to see precisely the data that you want to view.
Page Analyzer Viewer
The Page Analyzer Viewer Report window (Figure 2-11) allows you to view the performance of Web screens that are visited during a synthetic transaction. The Page Analyzer Viewer Report window gives details about the timing, size, identity, and source of each item that makes up a page. You can use this information to evaluate Web page design regarding efficiency, organization, and delivery.
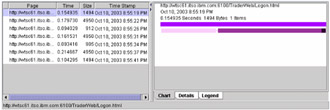
Figure 2-11: Page Analyzer Viewer
A more detailed introduction to the reporting capabilities of TMTP is included in Chapter 7, "Real-time reporting" on page 211. Historical reporting using the Tivoli Data Warehouse is covered in Chapter 10, "Historical reporting" on page 375. Additionally, several of the chapters include scenarios that show how to use the reporting capabilities of the TMTP product in order to identify e-business transaction problems. This is important, as the dynamic nature and drill down capabilities of reports (such as the Topology overview) are very powerful problem solving and troubleshooting tools.
|
| < Day Day Up > |
|
EAN: 2147483647
Pages: 105