Chapter 2: The Code Investigator s Toolkit
This chapter is dedicated to various software tools for investigating and patching executable modules.
2.1. Overview of the Code Investigator's Toolkit
In this section, I briefly overview of the software tools most often used for code investigation. I'll also provide several examples illustrating the use of these instruments.
Some programs covered here were created by enthusiastic individuals; therefore, their life cycle is short. The main goal of this chapter is not only to describe these tools but also to show you what instruments are available for studying the executable code and what can be expected from these tools. The principles of using such programs are similar in many respects. For example, all debuggers implement such an instrument as breakpoints. After you become acquainted with the operating principle of one debugger, you'll feel at ease with the other representatives of this class of programs and will be able to use them in your day-to-day activities.
2.1.1. Disassemblers
The Dumpbin.exe Program
The dumpbin.exe utility is supplied as part of the Visual Studio .NET distribution set. It is used for investigation of loadable object modules in the COFF format and outputs the information into the current console. Console output can always be redirected into a file. Proceeding this way, you'll be able to study the disassembled code in detail. Despite its console nature, this is a useful program suitable for analysis of small programs.
The command-line options of this program are as follows:
-
/ALL — Displays all available information about the module, except for the Assembly code.
-
/ARCH — Outputs the contents of the .arch section of the module header.
-
/ARCHIVEMEMBERS — Displays minimal information about elements of the object library.
-
/DEPENDENTS — Displays the names of DLLs, from which the module imports functions.
-
/DIRECTIVES — Displays the contents of the .drectve section created by the compiler (only for object modules).
-
/DISASM — Disassembles the contents of the module sections using debug info (if present).
-
/EXPORTS — Displays the names exported by the module.
-
/FPO — Outputs frame pointer omission (FPO) to the console.
-
/HEADER — Outputs to the console the headers of the module and all its sections. In case of the object library, it displays the headers of all its modules.
-
/IMPORTS — Displays the names imported by this module.
-
/LINENUMBERS — Displays the numbers of the object module lines (if any).
-
/LOADCONFIG — Displays the IMAGE_LOAD_CONFIG_DIRECTORY structure used by the loader and defined in the winnt.h file.
-
/LINKERMEMBER[:{1|2}] — Outputs all names in the object library, which are defined as public:
-
/LINKERMEMBER:1 — Outputs in the order, in which object modules appear in the library
-
/LINKERMEMBER:2 — First displays the offset and index of object modules, followed by the alphabetically ordered lists of names for each module
-
/LINKERMEMBER — Uses a combination of options 1 and 2
-
-
/OUT — Specifies that the output must occur into the file instead of the console. For example: /OUT:ED.TXT. It is also possible to redirect the output into the file using the redirection character (>).
-
/PDATA — Outputs the contents of exception tables (for reduced instruction set computing processors).
-
/RAWDATA — Outputs the dump of each file section. The following variants of this option are possible: /RAWDATA:BYTE, /RAWDATA:SHORTS, /RAWDATA:LONGS, /RAWDATA:NONE, and /RAWDATA:, number. Here, the number parameter defines the line width.
-
/RELOCATIONS — Outputs all relocations within the relocation table.
-
/SECTION:section — Defines the specific section.
-
/SUMMARY — Displays minimal information about sections.
-
/SYMBOLS — Outputs the symbolic table of the COFF file.
The following is an example of command-line use:
dumpbin /disasm prog.exe >prog.txt
Thus, the disassembled program code will be redirected into the prog.txt file.
A specific feature of the dumpbin.exe program is that it disassembles only sections with known names (see Section 1.5.3). If you place executable code into a section with an arbitrary name (one that is not predefined), then the program won't output disassembled code, although it would still produce a dump.
As an example, consider the investigation of the relocations table of a DLL (see Section 1.5.3) using the dumpbin.exe program. For this investigation, I have chosen a simple DLL written in Assembly language. Assume that the name of this library is prog.dll. To begin the investigation, issue the dumpbin/disasm prog.dll command. Listing 2.1 provides the code lines that represent the disassembled listing of the executable code of this module. Some of the code lines are supplemented with my comments.
Listing 2.1: Disassembled listing of the executable code produced by the dumpbin.exe utility
10001000: B8 01 00 00 00 mov eax, 1 ; Start of entry point procedure 10001005: C2 OC 00 ret OCh 10001008: 55 push ebp ; Start of exported function 10001009: 8B EC mov ebp, esp 1000100B: 83 7D 08 01 cmp dword ptr [ebp + 8], 1 1000100F: 75 13 jne 10001024 10001011: 6A 00 push 0 10001013: 68 26 30 00 10 push 10003026h 10001018: 68 3E 30 00 10 push 1000303Eh 1000101D: 6A 00 push 0 1000101F: E8 04 00 00 00 call 10001028 ; API call 10001024: 5D pop ebp 10001025: C2 04 00 ret 4 10001028: FF 25 00 20 00 10 jmp dword ptr ds:[10002000h]
Now output the relocation table and try to find out, which commands correct the addresses when loading this library. To achieve this, issue the dumpbin /relocations prog.dll command. The result of command execution is shown in Listing 2.2.
Listing 2.2: The result of execution of the dumpbin /relocations prog.dll command
BASE RELOCATIONS #4 1000 RVA, 10 SizeOfBlock 14 HIGHLOW 10003026 19 HIGHLOW 1000303E 2A HIGHLOW 10002000
Most interesting is the leftmost column, which contains the operand offset that must be taken into account when loading this DLL into the main memory. For example, the value 14 means that the address value is 10001014. Thus, you come to the push 10003026h command. The operand of this command is some address that must be corrected if this DLL is going to be loaded by a base address other than 10000000h.
The IDA Pro Disassembler
This famous disassembler, which hasn't been outperformed yet, will be covered in detail in Chapter 5. When I was writing this book, I considered version 4.7; according to information published at the product's official site, http://www.idapro.com, the differences between this version and the newly-released version 4.9 are minor for the tasks that will be considered in this book.
By the way, IDA Pro is not only a disassembler but also a debugger. Nevertheless, I'll consider this product mainly as a disassembler because disassembling functions fulfill its main role.
W32Dasm
This disassembler will be covered in detail in Section 2.2. This program, like IDA Pro, also provides debugging capabilities. However, to all appearances, the project isn't being developed anymore. Version 10 of this product, which will be considered in this book, apparently was created by individuals other than the initial development team. You also can find version 8.98 of this product on the Internet
Specialized Disassemblers
What are specialized disassemblers? I consider specialized the disassemblers that are oriented toward specific compilers. Note that I don't mean decompilers. Translation of the executable code into the program source code — in other words, de-compilation — is in general impossible. Specialized disassemblers recognize language structures, such as classes, events, and methods, and disassemble them. In this respect, Delphi is mentioned most often because analysis of programs written in Delphi is complicated when using a normal disassembler. The only program known to me that satisfactorily tackles the task of disassembling programs written using Delphi and C Builder is the DeDe disassembler (DeDe stands for Delphi Decompiler). The official site of the developer of this disassembler can be found at http://dafixer.cjb.net/.
Using DeDe, you'll gain a complete understanding of the hierarchy of the program objects within minutes. Furthermore, you'll be capable of viewing Assembly code of any event, such as clicking a button or an event related to form creation. Fig. 2.1 shows one of the program windows, displaying the disassembled code of the button-clicking event.
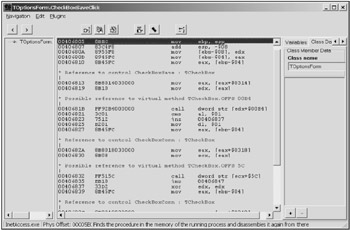
Figure 2.1: The DeDe program window displaying the disassembled code of a button-click event in an application
2.1.2. Debuggers
Debuggers are programs that allow step-by-step execution of programs in machine code. All known programming environments have built-in debuggers. These built-in tools won't be considered here. The main goal of this material is to consider independent standalone debugging tools. Most contemporary debuggers can correctly interpret the structure of the debug info produced by the main contemporary compilers, provided that such information is present in the module being debugged. In this case, they are capable of debugging programs both at the level of Assembly code and at the level of the application source code, which considerably simplifies the program analysis. However, such situations are rarely encountered. As a rule, only programming beginners leave the debug info in the release version.
Another specific feature typical for contemporary debuggers is support of some features characteristic for disassemblers: for example, recognition of library and API functions and possibilities of correcting the code and providing comments. Thus, the convergence of debuggers and disassemblers is obvious. Earlier, I mentioned that most disassemblers can execute the module in the debug mode. Thus, as you can see, this convergence is bidirectional. As you'll see later, the most efficient approach to code investigation is the combined use of debuggers and disassemblers.
Turbo Debugger
Turbo Debugger was one of the most popular debuggers during the 1990s. Unfortunately, nowadays it is no longer supported by Borland. The version from the 1990s, which is freely distributed over the Internet, is unstable under Windows NT/2000/XP/2003. [1] Nevertheless, it is possible to use this debugger for educational purposes and for debugging small applications (Fig. 2.2).
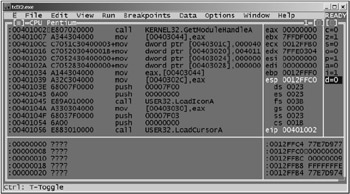
Figure 2.2: The Turbo Debugger window with a program loaded for debugging
Debugging Tools for Windows
The Debugging Tools for Windows set of programs is supplied as part of the driver development kit (DDK) for Microsoft's Windows XP distribution. Recently, it was possible to download this package directly from Microsoft's Web site: http://www.microsoft.com. This toolset allows debugging of both user-mode applications and kernel-mode drivers. It includes version 6.0 of the windbg.exe debugger (Fig. 2.3), equipped with a GUI. A detailed description of this debugger won't be provided here. It is only necessary to mention that this is an event-driven debugger: The user sets breakpoints to specific API functions or attempts to access a specific memory area of the application being debugged. Then the user starts working in the debug mode and waits for the debugger to break program execution because of the call to the chosen function or an attempt at accessing the specified memory region. After that, it is possible to find the code that tried to call the function or access the memory, and analyze that fragment. This working mechanism will be covered in detail in Chapter 4, when the SoftIce debugger is covered in more detail.
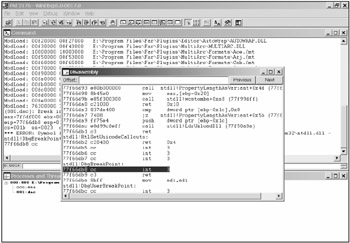
Figure 2.3: Graphical user interface of the windbg.exe program
The OllyDbg Debugger
OllyDbg is one of the best application-level debuggers. It will be covered in more detail in Section 2.3. The discussion forum concerning this debugger can be found at the following address: http://ollydbg.win32asmcommunity.net/stuph/. The official site of the product is http://www.ollydbg.de.
The SoftIce Debugger
The most powerful debugging tool is indisputably SoftIce, originally from NuMega Lab. In 1997, this company was purchased by Compuware. The name SoftIce refers to how, when this debugger is actuated, all other software running on the computer is "frozen." You'll obtain a "snapshot" of the entire system. Chapter 4 is dedicated to this excellent product.
Information about this debugger, as well as other NuMega Lab products, can be found at the following address: http://www.compuware.com/products/numega.htm.
2.1.3. Hexadecimal Editors
What are hex editors? Hex is an abbreviation of hexadecimal, which means that these editors work with hexadecimal numbers, or, to be precise, with data in the hex format. Normally, they are used for editing files; however, they also might edit disk regions. Advanced hex editors can disassemble binary code and introduce modifications by specifying command mnemonic.
The WinHex Program
This program provides a rich set of functional capabilities. For example, it can do the following:
-
Work with various files and recognize a large number of formats. It carries out lots of operations over files, including encrypting, comparing, splitting, and merging files.
-
Carry out low-level disk operations. This program is indispensable when recovering lost or damaged files.
-
Edit files located directly in the memory.
The site of the developers of this program can be found at http://www.x-ways.net/. However, this program lacks disassembling capabilities, which somewhat reduces its value for code investigation.
The Hacker Viewer (hiew.exe) Program
This program is widely used and is popular with programmers involved in investigation and correction of the executable code. Its name stands for Hacker's view. The main task carried out by this program is viewing and editing loadable modules. The advantage of this program is that editing is possible in three modes: binary, text, and Assembly code.
This program has a console interface (Fig. 2.4). All commands are executed using functional keys (including combinations with the <Alt> and <Ctrl> keys). For example, by pressing <F4>, you'll be able to choose the method of representing binary files: text, Assembly, or binary mode. By pressing <F3> (provided that you are viewing a file in the binary or Assembly mode), you'll gain the possibility of editing the file. If you are working in the Assembly viewing mode and press <F2> after <F3>, then you'll be able to edit the machine command in the symbolic view. I won't concentrate your attention on the commands of this program because they are simple and self-evident. Furthermore, the complete list of these commands can be obtained by pressing <F1>. Now, consider a simple example illustrating the use of this program.
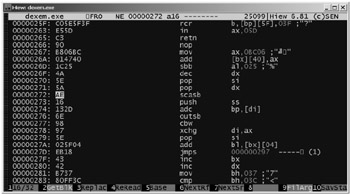
Figure 2.4: The hiew.exe program interface
Listing 2.3 presents a simple console program written in the Assembly language. This program displays a text string on the screen.
Listing 2.3: A simple console application that displays a text string
.586P .MODEL FLAT, stdcall ; Constants STD_OUTPUT_HANDLE equ -11 INVALID_HANDLE_VALUE equ -1 ; Prototypes of external procedures EXTERN GetStdHandle@4:NEAR EXTERN WriteConsoleA@20:NEAR EXTERN ExitProcess@4:NEAR ; Linker directives for linking libraries includelib f:\masm32\lib\user32.lib includelib f:\masm32\lib\kernel32.lib ;---------------------------------------------------------------------- ;Data segment _DATA SEGMENT BUF DB "Output string", 0 LENS DWORD ? ; Number of displayed characters HANDL DWORD ? _DATA ENDS ; Code segment _TEXT SEGMENT START: ; Obtain the output handle. PUSH STD_OUTPUT_HANDLE CALL GetStdHandle@4 CMP EAX, INVALID_HANDLE_VALUE JE _EX MOV HANDL, EAX ; String output PUSH 0 PUSH OFFSET LENS PUSH 17 PUSH OFFSET BUF PUSH HANDL CALL WriteConsoleA@20 _EX: PUSH 0 CALL ExitProcess@4 _TEXT ENDS END START
The program shown in Listing 2.3 is easy and correct. Now assume that in the course of debugging you have accidentally changed a single command. For instance, assume that you replaced the JE command with JNE. As a result, after translation the program ceased to operate. Is it possible to correct the error without resorting to editing the Assembly code? The answer is yes. To achieve this, it is necessary to disassemble the program, find an error, and then use hiew.exe. In general, it is possible to do without the disassembler, using only hiew.exe, because it is suitable for disassembling small programs. Nevertheless, to make this example more illustrative, this investigation will be conducted in two stages.
Disassemble the module using the dumpbin.exe utility. The disassembled code is provided in Listing 2.4.
Listing 2.4: Disassembled code of the simple console program provided in Listing 2.3
Dump of file cons1.exe File Type: EXECUTABLE IMAGE 00401000: 6AF5 push OF5h 00401002: E825000000 call 00401032 00401007: 83F8FF cmp eax, 0FFh 0040100A: 751E jne 0040102A 0040100C: A316304000 mov [00403016], eax 00401011: 6A00 push 0 00401013: 6812304000 push 403012h 00401018: 6A11 push 11h 0040101A: 6800304000 push 403000h 0040101F: FF3516304000 push dword ptr ds:[00403016h] 00401025: E80E000000 call 00401038 0040102A: 6A00 push 0 0040102C: E80D000000 call 0040103E 00401031: CC int 3 00401032: FF2508204000 jmp dword ptr ds:[00402008h] 00401038: FF2500204000 jmp dword ptr ds:[00402000h] 0040103E: FF2504204000 jmp dword ptr ds:[00402004h]
The disassembled code allows you to easily detect the error. By the way, the cmp eax, OFFFFFFFFh command must be interpreted as cmp eax, -1. Memorize the required code: 83F8FFH. Now start hiew.exe, press <F7>, and search for the required combination. Having located it, press <F3> then <F2>. Then replace the JNE command with JE. Press <F9> to save the change. Thus, you have corrected the program without retranslating it. It is also possible to find the required command at the 00401007H address, because hiew.exe correctly displays the virtual addresses of the disassembled sections.
In addition to the PE format, hiew.exe supports other executable file formats, such as MZ, NE, LX, LE, and ELF. The author of this program is Eugene Suslikov. The program support site address is http://www.serje.net/sen/.
The biew.exe Editor
In its interface and system of commands, this program is close to hiew.exe. It also supports a large number of executable file formats. The program support site is http://biew.sourceforge.net. The latest released version is 5.6.2.
2.1.4. Other Utilities
There are lots of programs intended to help investigators understand the structure of the executable module and analyze the executable code contained there. All such utilities carry out specialized functions. For example, PE browsers allow you to obtain the most complete information about the executable module. An example of such a simple browser is the program presented in Appendix 1. More advanced browsers allow you to edit the PE header by correcting the field contents, adding new sections, etc. Two other types of researcher tools will be covered in the next few sections. Individual programs won't be covered in detail, first because they are numerous and second because most of them are no longer supported by their authors.
Resource Viewers
There are lots of programs capable of viewing the resources of executable modules. Programs capable of extracting resources and saving them in binary format or in the form of a text files with the .rc file name extension are less numerous. Careful attention must be drawn to more advanced programs capable of editing resources directly in the executable module.
Fig. 2.5 shows the dialog of the Resource Hacker program, allowing you to edit resources directly in executable modules. Pay special attention to the left pane of the window, where all resources of a given program are listed in the form of a hierarchical structure. The right pane of the window contains the resource code in the RC format. You can directly modify the resource code in the right window pane and then press the Compile Script button to compile the resource code and place it into the executable module. Using the Show Dialog button, it is possible to open the dialog editor, edit the resource using visual GUI tools, and then place it again into the executable module.
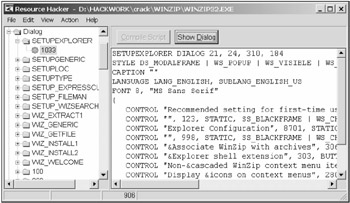
Figure 2.5: Resource Hacker is one of the most advanced resource editors, allowing you to edit resources directly in the executable module
Monitors
Monitors are a special kind of program intended for tracking specific events occurring in the system. In relation to the disassembling tasks, monitors trace specified actions carried out by programs being investigated. There are two types of monitors that are of the most interest to code investigators: registry monitors that track all attempts at accessing the system registry, and file monitors that trace attempts at accessing the entire file system.
Fig. 2.6 shows the window of the Registry Monitor (regmon.exe) utility, which tracks attempts of the application programs at accessing the system registry. Having obtained and saved such a log (see Fig. 2.6), it is possible to easily determine, which actions were carried out by a specific program and what that program attempted to do with the system registry. This information provides an important clue for searching the required location in the executable code. File monitors operate in a similar way; however, as mentioned before, they trace all attempts at accessing the entire file system.
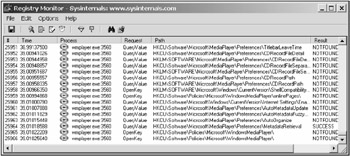
Figure 2.6: The Registry Monitor by Mark Russinovich, a program that tracks all attempts at accessing the system registry carried out by application programs
There is another type of program working with the system registry, namely, registry scanners. Scanners can determine, which registry entries were accessed during the specified time interval. Often, such programs are even more convenient than monitors.
[1]Here is a quotation from the warning published on the official Borland site: "The Turbo Debugger is provided 'as is,' without warranty of any kind. Borland does not offer technical support or accept bug reports on this version and it will not be updated or upgraded. The latest, supported version of our debugger is available in Borland C++ Builder."
EAN: 2147483647
Pages: 63