Section 10.13. Alternate Interaction Notations
10.13. Alternate Interaction NotationsUML provides several notations for capturing interactions. The first part of this chapter used the sequence diagram notation. The remainder of this chapter describes the other notations available and when they may be more appropriate than sequence notation. Figure 10-36. The final sequence, with all continuations expanded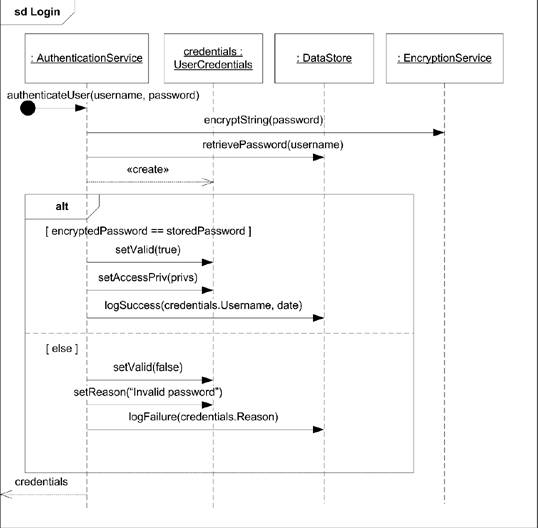 10.13.1. Communication DiagramsCommunication diagrams allow you to focus on the elements involved in interactions rather than the detailed sequencing and flow control allowed in sequence diagrams. Most UML tools can automatically convert from a sequence diagram to a communication diagram; however, because communication diagrams aren't as expressive,.some information may be lost. When you're modeling with communication diagrams, objects are represented by a rectangle, and connections between objects are shown as a solid line. Each message has a sequence number and a small arrow indicating the direction of the message along a given connection. Communication diagrams can't show message overtaking (see Figure 10-6 earlier in the chapter) or interaction fragments. Figure 10-38 shows a simple sequence diagram and the equivalent communication diagram. The syntax for a message name is: sequence_number: name [ recurrence_or_guard ] Figure 10-37. A sequence diagram with hard timing requirements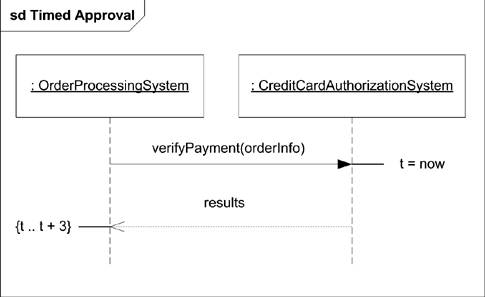 Figure 10-38. Example of a sequence diagram and its equivalent communication diagram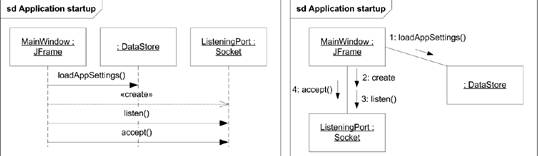 where:
10.13.2. Interaction Overview DiagramsInteraction overview diagrams represent interactions using a simplification of the activity diagram notation (see Chapter 9). Interaction overview diagrams can help you visualize the overall flow of control through a diagram; however, they don't show detailed message information. You can embed interactions or interaction occurrences inside an interaction overview diagram if it is helpful to see message details for a subset of the overall interaction. Several sequence diagram concepts are supported in interaction overview diagrams:
Figure 10-39 is an interaction overview diagram showing a subset of the interaction shown in Figure 10-36. 10.13.3. Timing DiagramsTiming diagrams are a special representation of interactions that focus on the specific timings of messages sent between objects. You can use timing diagrams to show detailed time constraints on messages or to show when changes occur within lifelines with respect to time. Timing diagrams are most often used with real-time or embedded systems. Unlike sequence diagrams, timing diagrams are read left to right rather than top to bottom. You show a lifeline name along the left edge of the diagram. The various states of the lifeline are then listed, followed by a graphical representation of the transitions between these states. Figure 10-40 shows an example of a timing diagram in which the MailServer object progresses through several states. In Figure 10-40, the MailServer starts in the Idle state until the Login event occurs. The Login event causes the MailServer to transition to Authenticated. When the sendMail event occurs, the MailServer transitions to transmitting and remains there until disconnected. Figure 10-39. Example of an interaction overview diagram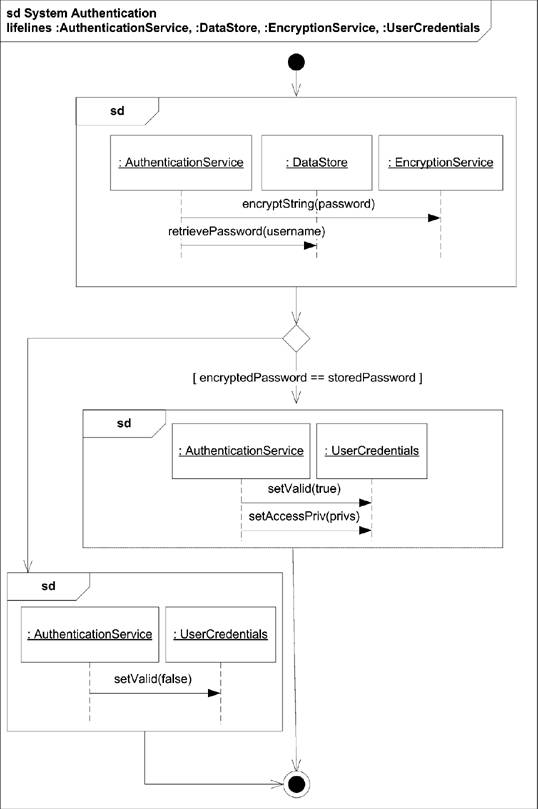 Figure 10-40. Simple timing diagram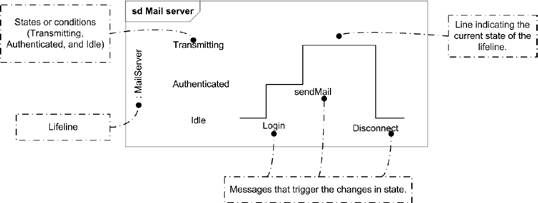 When reading the diagram left to right, you can use the length of the timeline to indicate how long the object remains in a particular state. To associate time measurements, you show tick marks along the bottom part of the frame, as shown in Figure 10-41. Figure 10-41. Timing diagram with tick marks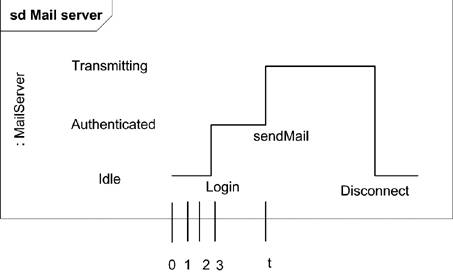 Figure 10-41 shows that the Login event is received three time units after the start of the sequence. To show relative times, you can mark a specific instance in time using a variable name. Figure 10-41 marks the time the sendMail event is received as time t. You can use relative time marks in constraints to indicate that a message must be received within a specified amount of time. Figure 10-42 shows the Disconnect message must be received within 10 time units of the sendMail event. You can show multiple objects involved in a timing diagram by stacking the lifelines. You show messages between objects using an arrow from one timeline to another. The start and end of the arrow correspond to when the message is sent and received. This notation shows the triggers that cause a transition; however it Figure 10-42. Timing diagram with time constraints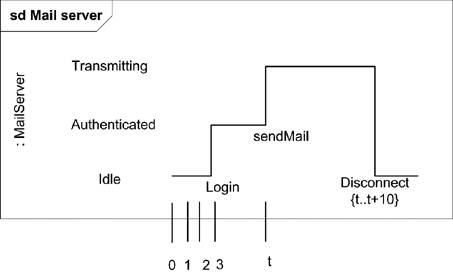 very quickly becomes unreadable if a lot of messages are exchanged. Figure 10-43 shows the MailServer talking with a client, Desktop. Figure 10-43. Timing diagram with multiple lifelines and messages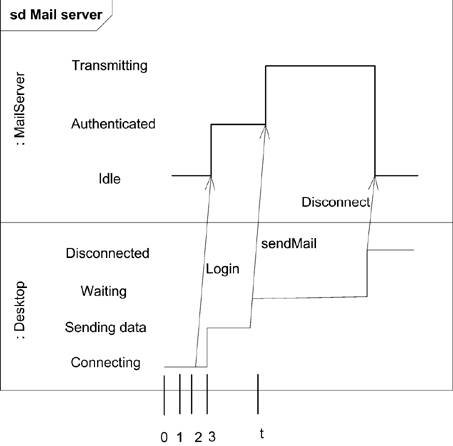 UML provides a variation on the timeline notation that simplifies diagrams by showing state names between two horizontal lines that cross when the state changes. This notation makes it much easier to show multiple objects along a single timeline, but it doesn't show the messages that trigger transitions. Figure 10-44 shows the MailServer and Client lifelines progressing through state transitions. Figure 10-44. Timing diagram using a simpler timeline notation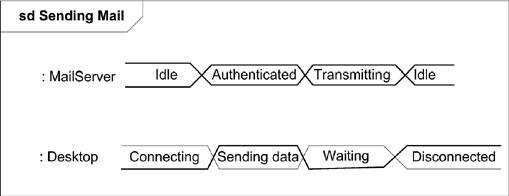 |
EAN: 2147483647
Pages: 132