Creating the Project Schedule
|
| < Day Day Up > |
|
The project manager, the project team, and possibly even the key stakeholders, will examine the inputs previously discussed, and apply the techniques discussed in this section to create a feasible schedule for the project. The point of the project schedule is to complete the project scope in the shortest amount of time possible without incurring exceptional costs, risks, or a loss of quality.
Creating the project schedule is part of the planning process group. It is calendar-based and relies on the project network diagram and the accuracy of time estimates.
Applying Mathematical Analysis
Mathematical analysis is the process of factoring theoretical early and late start dates and theoretical early and late finish dates for each activity within the PND. The early and late dates are not the expected schedule, but rather a potential schedule based on the project constraints, likelihood of success, and availability of resources, and other constraints. There are three common methods for mathematical analysis:
-
Program Evaluation and Review Technique (PERT) PERT uses a weighted average formula to predict the length of activities and the project. Specifically, PERT uses a 'pessimistic,' 'optimistic,' and 'most likely' estimate to predict when the project will be completed. Figure 6-6 shows the formula and typical outcome of using PERT. Note that PERT is rarely used in today's project management practices.
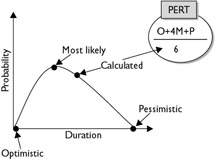
Figure 6-6: PERT uses a weighted average to predict when the activities will end. -
Graphical Evaluation and Review Technique (GERT) GERT uses conditional advancement, branching, and looping of activities and is based on probable estimates. Activities within GERT are dependent on the results of other upstream activities. For example, the results of a work package may determine if additional testing is needed, rework is required, or the project may continue as planned.
-
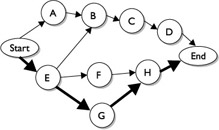
Critical Path Method (CPM) This is the most common approach to calculating when a project may finish. It uses a 'forward' and 'backward' pass to reveal which activities are considered critical. Activities on the critical path may not be delayed; otherwise, the project end date will be delayed. The critical path is the path with the longest duration to completion. Activities not on the critical path have some float (also called slack) that allows some amount of delay without delaying theproject end date. The following illustration is anexample of the critical path.
Exam Watch
The critical path is used to determine which activities have no float. You can also use the critical path to determine the earliest date for when the project may be completed. There can be more than one critical path in a project. It is possible for the critical path to change.
Calculating Float in a PND
Float, or slack, is the amount of time a delayed task can delay the project's completion. Technically, there are three different types of float:
-
Free float This is the total time a single activity can be delayed without delaying the early start of any successor activities.
-
Total slack This is the total time an activity can be delayed without delaying project completion.
-
Project slack This is the total time the project can be delayed without passing the customer-expected completion date.
Most project management software will automatically calculate float, on the PMP exam; however, candidates will be expected to calculate float manually. Don't worry; it's not too tough. Here's the process:
Examine the PND and find the critical path. The critical path is typically the path with the longest duration and will always have zero float. The critical path is technically found once you complete the forward and backward pass. Start with the forward pass, after the backward pass you can identify the critical and near critical path, as well as float.
-
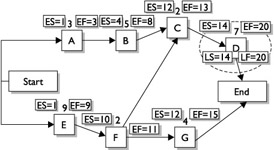
The Early Start (ES) and Early Finish (EF) dates are calculated first by completing the 'forward pass.' The ES of the first task is one. The EF for the first task is its ES, plus the task duration, minus one. Don't let the 'minus one value' throw you. If Task A is scheduled to last one day, it would only take one day to complete, right? The ES would be 1, the duration is 1, and the EF would also be one because the activity would finish within one day, not two days. The following illustration shows the start of the forward pass.
-
The ES of the next task(s) will be the EF for the previous activity, plus one. In other words, if Task A finishes on day eight, Task B will begin on day nine.
-
The EF for the next task(s) equals its ES plus the task duration, minus one. Sound familiar?
-
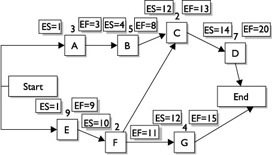
Now each task moves forward with the forward pass. Use caution when there are predecessor activities; the EF with the largest value is carried forward. The following illustration shows the completed forward pass.
-
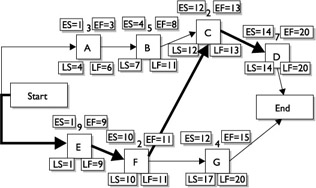
After the forward pass is completed, the backward pass starts at the end of the PND. The backward pass is concerned with the Late Finish (LF) and the Late Start (LS) of each activity. The LF for the last activity in the PND equals its EF value. The LS is calculated by subtracting the duration of the activity from its LF, plus one. The one is added to accommodate the full day's work; it's just the opposite of subtracting the one day in the forward pass. Here's a tip: the last activity is on the critical path, so its LS will equal its ES.
-
The next predecessor activity's LF equals the LS of the successor activity minus one. In other words, if Task Z has an LS of 107, Task Y will have an LF of 106. The following illustration shows the process of the backward pass.
-
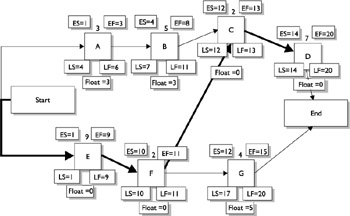
The LS is again calculated by subtracting the task's duration from the task's LF, plus one. The following shows the completed backward pass.
-
To officially calculate float, the LS is subtracted from the ES and the LF is subtracted from the EF. Recall the total float is the amount of time a task can be delayed without delaying the project completion date. The next illustration shows the completed PND with the float exposed.
Exam Watch
You'll have to calculate float on the exam. 'Du' means duration when shown in a PND. Always neatly draw the PND on your paper. The same network diagram may be used over and over throughout the exam-this saves time! Finally, find and mark the critical path first on your scratch paper. The question may want to know the float for a task on the critical path, which is zero, of course.
Encountering Scheduling on the PMP Exam
You'll encounter float, scheduling, and critical path activities on the PMP exam. You should count these questions as 'gimmies' if you remember a few important rules:
-
Always draw out the network diagram presented on your scratch paper; it may be used in several questions.
-
Know how to calculate float. (The complete process was shown earlier in the 'Calculating Float in a PND' section)
-
You may encounter questions that ask on what day of the week a project will end if no weekends or holidays are worked. No problem. Add up the critical path, divide by 5 (Monday through Friday), and then figure out which day of the week the activity will end on.
-
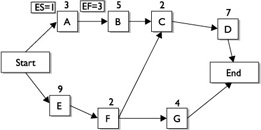
You may see something like Figure 6-7 when it comes to scheduling. When three numbers are presented, think PERT; optimistic is the smallest number, pessimistic is the largest, most likely is somewhere between the two. When a number is positioned directly over the tasks, it is the task duration. When a number is positioned to the upper-right of a task, this represents the Early Finish date.
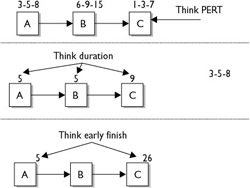
Figure 6-7: Scheduling follows many rules to arrive at the project destination.
Applying Duration Compression
Duration compression is also a mathematical approach to scheduling. The trick with duration compression, as its name implies, is calculating ways the project can get done sooner than expected. Consider a construction project. The project may be slated to last eight months, but due to the expected cold and nasty weather typical of month seven, the project manager needs to rearrange activities, where possible, to end the project as soon as possible.
In some instances, the relationship between activities cannot be changed due to hard or soft logic. The relationships must remain as scheduled. Now consider the same construction company that is promised a bonus if they can complete the work by the end of month seven. Now there's incentive to complete the work, but there's also the fixed relationship between activities.
To apply duration compression, the performing organization can rely on two different methods. These methods can be used independently or together and are applied to activities or the entire project based on need, risk, and cost. The methods are:
-
Crashing This approach adds more resources to activities on the critical path to complete the project earlier. When crashing a project, costs are added as the labor expenses increase. Crashing doesn't always work. Consider activities that have fixed duration and won't finish faster with additional resources. The project manager must also consider the expenses in relation to the gains of completing on time. For example, a construction company may have been promised a bonus to complete the work by a preset date, but the cost incurred to hit the targeted date is more than what the bonus offers.
-
Fast Tracking This method changes the relationship of activities. With fast tracking, activities that would normally be done in sequence are allowed to be done in parallel or with some overlap. Fast tracking can be accomplished by changing the relation of activities from FS to SS or by adding lead time to downstream activities. For example, a construction company could change the relationship between painting the rooms and installing the carpet by adding lead time to the carpet installation task. Before the change, all of the rooms had to be painted before the carpet installers could begin. With the added lead time, the carpet can be installed hours after a room is painted. Fast tracking increases risk and may cause rework in the project. Can't you just imagine those workers getting fresh paint on the new carpet?
Exam Watch
It's easy to remember the difference between these two actions. Crashing and cost both begin with C; we're adding resources and too many people will 'crash' into each other. Fast tracking is about speeding things up: haste makes waste-risky.
Using a Project Simulation
Project simulations allow a project manager to examine the feasibility of the project schedule under different conditions, variables, and events. For example, the project manager can see what would happen to a project if activities were delayed, vendors missed shipment dates, and external events affected the project.
Simulations are often completed with the Monte Carlo Analysis. The Monte Carlo Analysis, named after the world-famous gambling city, predicts how scenarios may work out given any number of variables. The process doesn't actually churn out a specific answer, but a range of possible answers. When Monte Carlo is applied to a schedule it can examine, for example, the optimistic completion date, the pessimistic completion date, and the most likely completion date for each activity in the project.
As you can imagine in a typical network diagram, there are likely thousands, if not millions, of combinations of tasks that complete early, late, or as expected. Monte Carlo analysis shuffles these combinations, usually through computer software, and offers a range of possible end dates coupled with an expected probability for achieving each end date.
In other words, Monte Carlo Analysis is an odds-maker; the project manager chooses, or is at least influenced, by the end date with the highest odds of completion in ratio to the demands for completion by an expected time. The project manager can then predict with some certainty that the project has an 85 percent chance of completion by a specific date.
Exam Watch
Monte Carlo Analysis can be applied to more than just scheduling. It can be applied to cost, project variables, and most often, risk analysis.
Simulations also provide time to factor in 'what-if' questions, worst-case scenarios, and potential disasters. The end result of simulations is to create responses to the feasible situations. Then, should the situations come into play, the project team is ready with a planned response.
Using Resource Leveling Heuristics
First off, a heuristic is a fancy way of saying 'rule of thumb.' A resource leveling heuristic is a method to flatten the schedule when resources are over-allocated. Resource leveling can be applied using different methods to accomplish different goals. One of the most common methods is to ensure that workers are not overextended on activities. Figure 6-8 is a screenshot from Microsoft Project 2002 where resource leveling has been applied.
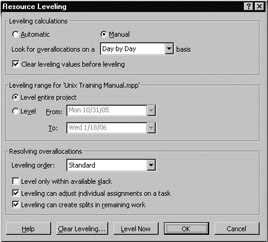
Figure 6-8: Resource leveling smoothes the schedule, but may extend the project end date.
For example, Sarah is assigned to Task C and Task H which both are planned to happen concurrently. Sarah cannot be in two places at once, so resource leveling changes the timing of the activities so Sarah can complete Task C and then move onto Task H. As expected, however, resource leveling often extends the project end date.
Another method for resource leveling is to take resources off of noncritical path activities and apply them to critical-path activities to ensure the project end date is met. This method takes advantage of available slack and balances the expected duration of the noncritical path with the expected duration of the critical path.
Resource leveling also provides for changing the project schedule to allow for long work hours to complete the project work-such as weekends, evenings, or even adding a second or third shift to bring the project back in alignment. Another approach, also part of resource leveling, is to change the resources, tools, or equipment used to complete the project work faster. For example, a project manager could request the printer to use a different, faster printing press to complete the printing activity than what was originally planned for. Of course, these approaches often increase cost.
Finally, some resources may be scarce to the project. Consider a highly skilled technician or consultant that is only available on a particular date to contribute to the project. These resources are scheduled from the project end date, rather than the start date. This is known as reverse resource allocation scheduling.
Using a Project Management Software
When it comes to project management software, take your pick: the market is full of them. Project management applications are tools, not replacements, for the project management process. Many of the software titles today automate the processes of scheduling, activity sequencing, work authorization, and other activities. The performing organization must weigh the cost of the PMIS against the benefits the project managers will actually use.
Exam Watch
Don't worry too much about software programs for the exam. Software helps the project manager; it doesn't replace the project manager.
Relying on a Project Coding Structure
The coding structure identifies the work packages within the WBS and is then applied to the PND. This allows the project manager, the project team, experts, and even key stakeholders, to extract areas of the project to examine, evaluate, and inspect. For example, a project to create a catalog for a parts distributor may follow multiple paths to completion. Each path to completion has its own 'family' of numbers that relate to each activity on the path. Consider Table 6-2:
| Path | Coding for Path | Typical Activities |
|---|---|---|
| Artwork | 4.2 | Concept (4.2.1) |
| Photography | 4.3 | Product models (4.3.1) |
| Content | 4.4 | Message (4.4.1) |
| | 4.5 | Signatures (4.5.1) |
| Bind | 4.6 | Assembly (4.6.1) |
| Distribution | 4.7 | Packaging (4.7.1) |
|
| < Day Day Up > |
|
EAN: 2147483647
Pages: 209