Chapter 28. Geometries and Paths
| The classes that derive from Shape include the (by now) familiar Rectangle, Ellipse, Line, Polyline, and Polygon. The only other class that derives from Shape is named Path, and it's absolutely the most powerful of them all. It encompasses the functionality of the other Shape classes and does much more besides. Path could potentially be the only vector-drawing class you'll ever need. The only real drawback of Path is that it tends to be a little verbose in comparison with the other Shape classes. However, toward the end of this chapter I'll show you a shortcut that Path implements that lets you be quite concise. The only property that Path defines is Data, which you set to an object of type Geometry. The Geometry class itself is abstract, but seven classes derive from Geometry, as shown in this class hierarchy: Object I've arranged those Geometry derivatives in the order in which I'll discuss them in this chapter. These classes represent the closest that WPF graphics come to encapsulating pure analytic geometry. You specify a Geometry object with points and lengths. The Geometry object does not draw itself. You must use another class (most often Path) to render the geometric object with the desired fill brush and pen properties. The markup looks something like this: <Path Stroke="Blue" StrokeThickness="3" Fill="Red"> <Path.Data> <EllipseGeometry ... /> </Path.Data> </Path> The LineGeometry class defines two properties: StartPoint and EndPoint. This stand-alone XAML file uses LineGeometry and Path to render two lines of different colors that cross each other.
Just as you can have multiple Line elements on the Canvas, you can have multiple Path elements, and each Path element can potentially have its own Stroke color and StrokeThickness. The RectangleGeometry class defines a Rect property (of type Rect, of course) that indicates the location and size of the rectangle, and RadiusX and RadiusY properties for the curvature of the corners. In XAML, you can set a property of type Rect by a string containing four numbers: the X coordinate of the upper-left corner, the Y coordinate of the upper-left corner, the width, and the height.
The StartPoint and EndPoint properties defined by LineGeometryand the Rect, RadiusX, and RadiusY properties defined by RectangleGeometryare all backed by dependency properties, which means that these properties can be animated (as you'll see in Chapter 30) and they can be targets of data bindings. EllipseGeometry contains a constructor that lets you base the ellipse on a Rect object. However, this facility is not available when you define an EllipseGeometry in XAML. Instead, you specify the center of the ellipse with a Center property of type Point and the dimensions of the ellipse with RadiusX and RadiusY properties of type double. All three properties are backed by dependency properties.
You might recall the DrawCircles program from Chapter 9 that lets you use the mouse to draw circles on a Canvas. The initial mouse click indicates the center of the circle and the later position of the mouse governs the radius. But that program uses an Ellipse element, which requires that the size of the ellipse be specified by its width and height. The location of the Ellipse on the Canvas is given by the Left and Top attached properties. When the DrawCircles program responds to mouse movements by expanding or contracting the circle, it needs to keep the ellipse centered on the same point, which requires moving the ellipse as well as increasing its size. If that program used EllipseGeometry instead, the logic would be simplified. The Path.Data property element can have only one child of type Geometry. As you've seen, you can get around this limitation by using multiple Path elements. Or, you can mix Path elements with other elements such as Rectangle. Another way to get around the limitation is to make a GeometryGroup object the child of Path.Data. GeometryGroup inherits from Geometry but has a property named Children of type GeometryCollection, which is a collection of Geometry objects. GeometryGroup can host multiple Geometry children. The markup might look something like this: <Path Fill="Gold" Stroke="Pink" ...> <Path.Data> <GeometryGroup> <EllipseGeometry ... /> <LineGeometry ... /> <RectangleGeometry ... /> </GeometryGroup> </Path.Data> </Path> Because all the Geometry objects in the GeometryGroup are part of the same Path element, they all have the same Stroke and Fill brushes. That's one major difference between using GeometryGroup rather than multiple Path elements. The other major difference is illustrated in this XAML file. On the left are two overlapping rectangles rendered by two separate Path elements. On the right are two overlapping rectangles that are part of the same GeometryGroup.
With the first pair of rectangles, one rectangle simply sits on top of the other. But for the second pair of rectangles joined in a GeometryGroup, the area where they overlap is transparent. What's happening here is exactly what happens when a Polygon element has overlapping boundaries. GeometryGroup defines its own FillRule property, and the default value of EvenOdd doesn't fill enclosed areas separated from infinity by an even number of boundary lines. You can alternatively set the FillRule to NonZero, like this: <GeometryGroup FillRule="NonZero"> In that case, the overlapping area will be filled, but the second pair of rectangles in the program still won't look like the first pair. With the first pair, the second rectangle obscures part of the first rectangle's border. With the second pair, all the borders are visible. You can get some interesting effects by combining multiple geometries in the same GeometryGroup.
That's the GeometryGroup class, and it's easy to confuse that class with another Geometry derivative named CombinedGeometry. But CombinedGeometry is quite different. First, it doesn't have a Children property. Instead, it has two properties named Geometry1 and Geometry2. CombinedGeometry is a combination of two and only two other geometries. The second difference between GeometryGroup and CombinedGeometry is that CombinedGeometry doesn't have a FillRule property. Instead it has a GeometryCombineMode property that you set to a member of the GeometryCombineMode enumeration: Union, Intersect, Xor, or Exclude. The first three options work like visual Venn diagrams; the Exclude option creates a geometry that consists of everything in Geometry2 that's not also in Geometry1. The following stand-alone XAML program demonstrates the four GeometryCombineMode options with two overlapping circles.
Notice how different these images are from every other type of combination of objects you've seen so far. Even the Union optionwhich at first seems to offer no benefits over two simple overlapping figuresproduces something different. The border of the combined circles goes around the composite object rather than the original objects. The CombinedGeometry can give you some effects that might otherwise be difficult. One example is this image of a dumbbell.
This image makes use of two nested CombinedGeometry objects. The first combines an ellipse and a rectangle; the second combines that CombinedGeometry with another ellipse. All three objects are combined with the Union mode. It is with the Geometry derivative named PathGeometry that we really get into the central focus of this whole geometry system. A graphics path is a collection of straight lines and curves, some of which might or might not be connected to each other. Any set of connected lines and curves within the path is known as a subpath, orto use the synonymous term consistent with the WPF classesa figure. Thus, a path is composed of zero or more figures. Each figure can be either open or closed. A figure is closed if the end of the last line in the figure is connected to the beginning of the first line. Otherwise, the figure is open. (Traditionally, an open path cannot be filled with a brush; in the WPF, filling is independent of closure.) Here's the brief rundown: A PathGeometry object is a collection of one or more PathFigure objects. Each PathFigure is a collection of connected PathSegment objects. A PathSegment is a single straight line or curve. Now for the details. The PathGeometry class defines a FillRule property that governs how figures in the path are filled, and a Figures property of type PathFigureCollection, which is the collection of PathFigure objects. PathFigure derives from Animatable and is sealed. (That is, no other classes derive from PathFigure.) PathFigure defines two Boolean properties named IsClosed and IsFilled. By default, IsClosed is false. If you set the property to true, the figure will be automatically closed. A straight line will be automatically added from the last point of the figure to the start point if necessary to close the figure. The default value of IsFilled is true and governs whether internal areas are colored with a brush. An area is filled as if the area is closed even if the area is not closed. (You encountered a similar concept in Chapter 27 in the way that Polyline fills areas.) Remember that a figure is a series of connected straight lines and curves. The figure has to start at some particular point, and that point is the StartPoint property of PathFigure. PathFigure also defines a property named Segments of type PathSegmentCollection, which is a collection of PathSegment objects. PathSegment is an abstract class with seven derivatives. The following class hierarchy shows all the path-related classes: Object In summary, the PathGeometry class has a Figures property of type PathFigureCollection. The PathFigure class has a Segments property of type PathSegmentCollection. For readers who have been wondering where Bézier curves have been hidden in the WPF graphics system, here they are. They come in two varieties: the normal cubic form and a faster quadratic variation. Here also are arcs, which are curves on the circumference of an ellipse. These are the only classes in WPF that explicitly support Bézier curves and arcs. Even if you're drawing graphics at the DrawingContext level (either in an OnRender method or by creating a DrawingVisual object), you don't have explicit Bézier or arc-drawing methods. Instead, you must draw Bézier curves or arcs using the DrawGeometry method or (more remotely) the DrawDrawing method. The classes that derive from PathSegment also provide you with the only way to create Geometry objects that describe arbitrary polygons. You might be able to patch polygons together using CombinedGeometry and rotation, but you'd probably go insane in the process. In any figure, the PathFigure object indicates the starting point of the figure in the StartPoint property. The LineSegment class therefore has only a single Point property that you set to the end point of a line. Here's a trivial path that consists of a single straight line.
To draw multiple connected straight lines, you can use multiple LineSegment objects. Each LineSegment object continues the figure with another segment that starts at the end of the previous segment. Here's a small XAML file that draws a five-pointed star with four LineSegment objects.
The star drawn by this markup might appear a little strange. The five points of the star are filled and the center is not filledwhich we might expect from the default FillRule of EvenOddbut the line from the lower-left point to the top point is missing. And sure enough, if you look at the markup, you'll see that the four LineSegment objects draw only four lines. You can fix this problem and make the star appear more normal by including a fifth LineSegment object with the same point specified in PathFigure: <LineSegment Point="144 72" /> Or, you can set the IsClosed property of the PathFigure to true: <PathFigure StartPoint="144 72" IsClosed="True"> Setting IsClosed to true automatically creates an additional straight line back to the starting point. The existence of this last line does not govern whether an internal area is filled. Whether areas are filled is based on the IsFilled property of PathFigure (which is true by default) and the FillRule of the Path element (which is EvenOdd by default). Another approach to drawing a series of connected straight lines is the PolyLineSegment. The Points property defined by PolyLineSegment is an object of type PointCollection, and as with the Points property defined by the Polyline element, you can set it to a string of multiple points in XAML. In this file I've explicitly set the IsClosed property of PathFigure to true:
If this PathFigure contained an additional segment following the PolyLineSegment, it would continue from the last point of the PolyLineSegment. The PathFigure element always defines the start of the figure. Each segment contains one or more points that continue the figure from the last preceding point. Five classes define a FillRule property. Both the Polyline and Polygon elements in the Shapes library define one, as well as GeometryGroup, PathGeometry, and StreamGeometry (which is conceptually similar to PathGeometry). With PathGeometry, the FillRule property also governs how overlapping multiple figures in the geometry are filled. Here's an example that combines two overlapping stars in the same PathGeometry.
The second star is offset from the first by one-quarter inch horizontally and one-quarter inch vertically. You'll see that the two stars are taken together to determine whether internal areas are filled based on the default FillRule of EvenOdd. If you enclose that PathGeometry in a GeometryGroup, the FillRule setting on the GeometryGroup takes precedence and the FillRule setting on the PathGeometry is ignored. Both stars will still be analyzed together to determine filling. If you need overlapping paths to be filled independently of each other, put them in separate Path elements. The ArcSegment class defines a curved line on the circumference of an ellipsea concept that turns out to be a little more complex than it first appears. Like LineSegment, the ArcSegment element defines just one point, and an arc is drawn from the last preceding point to the point specified in the ArcSegment element. However, some additional information is required in the ArcSegment element. The curve that connects the two points is an arc on the circumference of an ellipse, so the two radii of that ellipse need to be supplied. In the simplest case, the two radii are equal and the curve that connects the two points is actually an arc on the circumference of a circle. Still, in general there are four ways that an arc of that circle can connect the two points. Which one you get is governed by the SweepDirection property of ArcSegment, which you set to either Clockwise or Counterclockwise (the default) and the Boolean IsLargeArc property (false by default). The four possible arcs are demonstrated in the following program with different colors.
Each of the four Path elements uses the same starting point of (144, 144) and ArcSegment point of (240, 240). In all four cases the points are connected with an arc on the circumference of a circle with a radius of 96. But the four combinations of SweepDirection and IsLargeArc draw four different arcs in four different colors. And if this isn't enough flexibility for you, ArcSegment defines another property named RotationAngle that indicates the clockwise rotation of the ellipse whose circumference connects the points. The following program is identical to ArcPossibilities.xaml except that it uses an ellipse with a horizontal radius of 144 and a vertical radius of 96, rotated clockwise by 45 degrees.
The following program is closer to one that you'd find in real life. It draws something that might be a piece of an imaginary machinean outline consisting of straight lines and arcs, and also a hole comprising two arc segments.
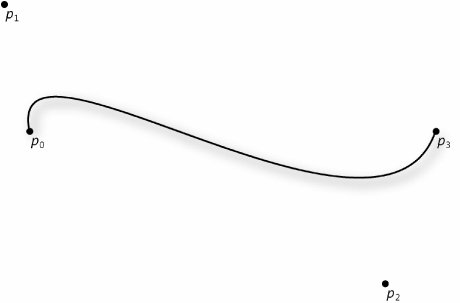
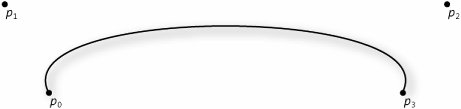
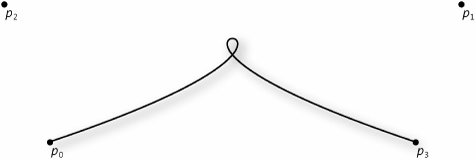
The second PathFigure effectively draws a circle by connecting two semicircle arcs. Most of the terminology used in computer graphics comes from geometry. But in one case, an actual person's name has been enshrined in the names of graphics drawing functions. Pierre Etienne Bézier was born in Paris in 1910 into a family of engineers. He received a degree in mechanical engineering in 1930 and a second degree in electrical engineering the following year. In 1933 he began working at the French automotive company Renault, where he remained until 1975. During the 1950s, Bézier was responsible for implementing some of the first drilling and milling machines that operated under NCthat is, numerical control (a term rarely used these days). Beginning in 1960, much of Bézier's work was centered around the UNISURF program, an early CAD/CAM system used at Renault for interactively designing automobile parts. Such a system required mathematical definitions of complex curves that designers could manipulate without knowing about the underlying mathematics. These curves could then be used in manufacturing processes. From this work came the curve that now bears Bézier's name. Pierre Bézier died in 1999. The Bézier curve is a spline, which is a curve used to approximate discrete data with a smooth continuous function. A single cubic Bézier curve is uniquely defined by four points, which can be labeled p0, p1, p2, and p3. The curve begins at p0 and ends at p3. Often p0 is referred to as the start point (or begin point) of the curve and p3 is referred to as the end point, but sometimes both points are collectively called end points. The points p1 and p2 are called control points. These two control points seem to function like magnets in pulling the curve toward them. Here's a simple Bézier curve showing the two end points and two control points. Notice that the curve begins at p0 by heading toward p1, but then abandons that trip and instead heads toward p2. Without touching p2 either, the curve ends at p3. Here's another Bézier curve: Only rarely does the Bézier curve pass through the two control points. However, if you position both control points between the end points, the Bézier curve becomes a straight line and passes through them: At the other extreme, it's even possible to choose points that make the Bézier curve do a little loop: To draw a single Bézier curve you need four points. In the context of a PathFigure, the first point (p0 in the diagrams) is provided by the StartPoint property of the PathFigure object or the last point of the preceding segment. The two control points and the end point are provided by the Point1, Point2, and Point3 properties of the BezierSegment class. The numbering of these three properties agrees with the numbering I've used in the preceding diagrams. Here's a small XAML program that produces a figure similar to the first Bézier diagram on the previous page.
To the actual Bézier curve I've also added four EllipseGeometry objects with bindings to display the end points and control points. The Bézier spline has achieved much prominence in graphics programming for several reasons, all of which become evident when you experiment with the curves a bit. That's the purpose of the following BezierExperimenter project, which consists of a XAML file and a C# file. The XAML file lays out a Canvas beginning with four EllipseGeometry objects. These display the four points that define the Bézier curve and they are given x:Name attributes that become variable names that the C# file uses to actually set the points.
The Canvas continues with a bunch of bindings, all of which reference the Center properties of the first four EllipseGeometry objects. A PathSegment draws the actual Bézier curve, and two gray lines connect the two end points with the two control points. (You'll see the rationale behind this shortly.) Finally, some labels print the actual values of the points, just in case you find a nice Bézier curve you want to reuse in some XAML markup. The C# portion of the program resets the four points whenever the size of the window changes.
The two end points are always fixed relative to the window. The left mouse button controls the first control point, and the right mouse button controls the second control point. As you experiment with this program, you'll find that with a little practice you can manipulate the curve into something close to the shape you want. The Bézier spline is very well controlled. Some splines don't pass through any of the points that define them. The Bézier spline is always anchored at the two end points. (As you'll see, this is one of the assumptions used to derive the Bézier formulas.) Some forms of splines have singularities where the curve veers off into infinityan effect rarely desired in computer-design work. The Bézier spline is much better behaved. In fact, the Bézier curve is always bounded by a four-sided polygon (called a convex hull) that is formed by connecting the end points and the control points. (The way in which you connect the end points and the control points to form this convex hull depends on the particular curve.) At the start point, the curve is always tangential to and in the same direction as a straight line drawn from the start point to the first control point. (This relationship is visually illustrated in the BezierExperimenter program.) At the end point, the curve is always tangential to and in the same direction as a straight line drawn from the second control point to the end point. These are actually two assumptions used to derive the Bézier formulas. Apart from the mathematical characteristics, the Bézier curve is often aesthetically pleasing, which is the primary reason that it's found such extensive applications in computer-design work. You can define multiple connected Bézier splines by setting the Points property of the PolyBezierSegment element. Although there are no restrictions on the number of points PolyBezierSegment is given, it really only makes sense if the number of points is a multiple of three. The first and second points are control points, and the third point is the end point. The third point is also the start point of the second Bézier curve (if any), and the fourth and fifth points are control points for that second Bézier. Although connected Bézier curves share end points, it's possible that the point at which one curve ends and the next one begins won't be smooth. Mathematically, the composite curve is considered smooth only if the first derivative of the curve is continuousthat is, it doesn't make any sudden changes. When you draw multiple Bézier curves, you might want the resultant composite curve to be smooth where one curve ends and the next one begins. Then again, you might not. It depends on what you're drawing. If you want two connected Bézier curves to join each other smoothly, the second control point of the first Bézier, the end point of the first Bézier (which is also the start point of the second Bézier), and the first control point of the second Bézier must be colinearthat is, lie on the same line. Here's a little XAML file that demonstrates a standard technique to simulate a circle with four connected Bézier splines. These end points and control points have the colinearity required for a smooth curve.
The simulated circle as defined by the Points array has a radius of 100 and is centered around the point (0, 0). The Left and Top attached properties of Canvas move the Path to a more visible location. The following program is a little variation of the simulated circle and draws an infinity sign with a linear gradient brush.
It's sometimes helpful to know the underlying mathematics that a graphics system uses to render particular curves, and even to actually derive the curves, if only so that you don't think the formulas just fell out of the sky one day. The cubic form of the Bézier spline is uniquely defined by four points, which I've called p0 (the begin point), p1 and p2 (the two control points), and p3 (the end point). These four points can also be denoted as (x0, y0), (x1, y1), (x2, y2), and (x3, y3). The general parametric form of a cubic polynomial in two dimensions is: x(t)=ax.t3+bx.t2+cx.t+dx y(t)=ay.t3+by.t2+cy.t+dy where ax, bx, cx, dx, ay, by, cy, and dy are constants, and t ranges from 0 to 1. Every Bézier spline is uniquely defined by these eight constants. The constants are dependent on the four points that define the curve. The object of this exercise is to derive the values of the eight constants in terms of the four points. The first assumption is that the Bézier spline begins at the point (x0, y0) when t equals 0: x(0)=x0 y(0)=y0 Even with this simple assumption we can make some headway in deriving the constants. If you put a 0 value for t in the parametric equations, you get: x(0)=dx y(0)=dy That means that two of the constants are simply the coordinates of the start point: 1a. 1b. The second assumption regarding the Bézier spline is that it ends at the point (x3, y3) when t equals 1: x(1)=x3 y(1)=y3 Substituting a value of 1 for t in the parametric equations yields the following: x(1)=ax+bx+cx+dx y(1)=ay+by+cy+dy This means that the constants relate to the coordinate of the end point like so: 2a. 2b. The remaining two assumptions involve the first derivative of the parametric equations, which describe the slope of the curve. The first derivatives of the generalized parametric equations of a cubic polynomial with respect to t are: x'(t)=3axt2+2 bxt+cx y'(t)=3ayt2+2 byt+cy In particular we're interested in the slope of the curve at the two end points. At the start point the Bézier curve is tangential to and in the same direction as a straight line drawn from the start point to the first control point. That straight line would normally be defined by the parametric equations: x(t)=(x1-x0)t+x0 y(t)=(y1-y0)t+y0 for t ranging from 0 to 1. However, another way of expressing this straight line would be the parametric equations: x(t)=3(x1-x0)t+x0 y(t)=3(y1-y0)t+y0 where t ranges from 0 to 1/3. Why 1/3? Because the section of the Bézier curve that is tangential to and in the same direction as the straight line from p0 to p1 is roughly 1/3 of the total Bézier curve. Here are the first derivatives of those revised parametric equations: x'(t)=3(x1-x0) y'(t)=3(y1-y0) We want these equations to represent the slope of the Bézier spline when t equals 0, so: x'(0)=3(x1-x0) y'(0)=3(y1-y0) Substitute 0 for t in the generalized cube first derivatives and you get: x'(0)=cx y'(0)=cy That means 3a. 3b. The final assumption is that at the end points, the Bézier curve is tangential to and in the same direction as a straight line from the second control point to the end point. In other words x'(1)=3(x3-x2) y'(1)=3(y3-y2) Since we know from the generalized formulas that x'(1)=3ax+2bx+cx y'(1)=3ay+2by+cy Then 4a. 4b. Equations 1a, 2a, 3a, and 4a provide four equations and four unknowns that let you solve for ax, bx, cx, and dx in terms of x0, x1, x2, and x3. Go through the algebra and you'll find: ax=-x0+3x1-3x2+x3 bx=3x0-6x1+3x2 cx=3x0+3x1 dx=x0 Equations 1b, 2b, 3b, and 4b let us do the same for the y coefficients. We can then put the constants back into the generalized cubic parametric equations: x(t)=(-x0+3x1-3x2+x3)t3+(3x0+6x1+3x2)t2+(3x0+3x1)t+x0 y(t)=(-y0+3y1-3y2+y3)t3+(3y0+6y1+3y2)t2+(3y0+3y1)t+y0 We're basically done. However, it's much more common for the terms to be rearranged to yield the more elegant and easier-to-use parametric equations: x(t)=(1-t)3x0+3t(1-t)2x1+3t2(1-t)x2+t3x3 y(t)=(1-t)3y0+3t(1-t)2y1+3t2(1-t)y2+t3xy3 These equations are the customary form in which the Bézier spline is expressed. Each point on the curve is a weighted average of the four points that define the curve. It's fairly easy to demonstrate that the equations I've derived match the algorithm that the WPF uses. The BezierReproduce project includes both BezierExperimenter.xaml and BezierExperimenter.cs and the following file, which includes a class that inherits from BezierExperimenter to draw a blue Polyline with calculated points for the Bézier spline.
Although the blue Polyline has only ten pointsit really looks more like a polyline than a curvethe match is very good. The Windows Presentation Foundation also supports a so-called quadratic Bézier curve, which has one control point rather than two. When drawing many curves, the quadratic curve is more efficient than the cubic Bézier. The QuadraticBezierSegment class has a Point1 property, which is the control point, and Point2, which is the end point. The PolyQuadraticBezierSegment class has a Points property that makes sense only when set to an even number of pointsalternating control points and end points. If the beginning point of the quadratic spline is (x0, y0), the control point is (x1, y1), and the end point is (x2, y2), the parametric formulas for the quadratic Bézier are x(t)=(1-t)2x0+2t(1-t)x1+t2x2 y(t)=(1-t)2y0+2t(1-t)y1+t2y2 How different is this curve from a cubic Bézier when both control points of the cubic Bézier are the same and equal to the single control point of the quadratic Bézier? The quadratic Bézier is roughly the average between the cubic Bézier and a straight line connecting the end points. It's actually possible to convince yourself of this relationship without looking at any curves! Consider a straight line between (x0, y0) and (x2, y2). What is the midpoint of that line? It's this: What is the midpoint of the quadratic Bézier curve that begins and ends at the same point with a control point of (x1, y1)? Substitute 0.5 for t in the quadratic formulas and you get and similarly for y. It's a weighted average of the three points. Substitute 0.5 for t in the cubic Bézier formulasand adjust the terminology so the two control points are both (x1, y1), and the end point is (x2, y2)and you'll derive The cubic Bézier places a greater weight on the control point and lesser weight on the end points than the quadratic curve. The average of the midpoint of the cubic Bézier and the straight line is That's close to the midpoint of the quadratic curve. Now that you have been introduced to all the PathSegment derivatives, it's time to unveil the path mini-language (more officially known as the PathGeometry Markup Syntax), which is a string encompassing all the types of path segments. You can set this string directly to the Data attribute of Path and any other property of type Geometry that you might encounter in other elements. Let's look at a little example first.
The mini-language alternates letter commands with numeric parameters. The M stands for move, and it's the equivalent of the StartPoint property of PathFigure. The point is (50, 75). The L is line, of coursethe three points that follow the L cause lines to be drawn from (50, 75) to (250, 75) to (250, 275) to (50, 275). The Z at the end doesn't stand for anything, except that as the last letter of the alphabet, it serves to close the figure (which is a 200-unit square). Another M command can follow to begin a new figure, or a new figure can implicitly begin at (50, 75), which is considered to be the last point of the figure after the figure is closed. New figures always begin with M or implicitly begin after a Z. The H and V commands draw horizontal and vertical lines, respectively, to the specified coordinate. The same square could be drawn like this: Data="M 50 75 H 250 V 275 H 50 Z" Lowercase letters generally do the same thing as their uppercase counterparts, except relatively rather than absolutely. This string also creates the same square, but the numbers following h and v indicate lengths rather than coordinates: Data="M 50 75 h 200 v 200 h -200 Z" The line-drawing command also comes in a relative version: Data="M 50 75 l 200 0, 0 200, -200 0 Z" If you want to set the FillRule to NonZero rather than the default EvenOdd, you need to include an F1 at the very beginning. (F0 just means the default.) The complete mini-language is described in the following table. In this table, the point (x0, y0) is the current point, which is initially the point set by the move command, and subsequently is the last point of the previous drawing command.
The smooth cubic Bézier ensures that the curve is connected smoothly to the previous curve by calculating the first control point. Thus the start point of the Bézier curve is the midpoint of a straight line from the second control point of the previous Bézier curve to the calculated point. That's ideal for the infinity sign, as demonstrated here.
You use geometries not only for drawing but for clipping. UIElement defines a property named Clip of type Geometry that you can set to any Geometry object, or you can set Clip directly to a path mini-language string directly in XAML. Any part of the geometry that would not normally be filled if the geometry were being drawn is not displayed by the element. For example, the following XAML file sets the Clip property of a button to a mini-language string that defines four arcs. The first two effectively define an ellipse the width and height of the button, and the second defines a little circle within that ellipse.
The following program displays a famous image from the NASA Web site and clips it to an outline of a keyhole.
The outlines of the fonts that we use under Windows are defined by cubic and quadratic Bézier curves. Displayable font characters are created from these curves in a process called rasterization. These curves are not used blindly in this process, however. The font files contain "hints" so that rounding errors inherent in rasterization do not make the font characters unreadable at the small sizes common on video displays. It's possible, however, to obtain font character outlines in the form of unhinted geometries. You can then use these outlines for certain graphical techniques that might not be possible otherwise. You'll recall the FormattedText class, I hope. You use that class to prepare text for the DrawText method of the DrawingContext class. That class has a BuildGeometry method that returns an object of type Geometry containing the character outlines of the text. However, some problems exist with using the FormattedText class directly in XAML. You could certainly create a FormattedText object as a resource, but BuildGeometry is a method rather than a property, so it wouldn't be accessible by XAML elements. Another approach you might consider is creating a class that derives from Geometry. Such a class could be used wherever any other Geometry derivative appears. This, too, is impossible. Not enough information is documented to successfully inherit from Geometry itself, and all the other classes that inherit from Geometry are sealed. After encountering these obstacles I wrote the following simple class that has properties that parallel the arguments required for the FormattedText constructor, and another property named Geometry that calls the BuildGeometry method on the FormattedText object.
This class certainly isn't very sophisticated. It doesn't have any dependency properties, but all I really wanted (for the moment) was something I could create as a resource and assign various properties. Then I could use the Geometry property as a one-time binding source. The XAML file that makes use of this class is shown next. Sure enough, it creates two TextGeometry objects as resources. One contains the word "Hollow" and the other contains the word "Shadow," both with a 144-point Times New Roman Bold font.
The window contains a TabControl with three tabs that reveal what the program does with the Geometry property of the TextGeometry objects. The first TabItem simply strokes the path with a blue brush. It sounds simple, but it creates outlined font characters, which as far as I know aren't available in WPF any other way. The second TabItem does something similar but draws the outline with a dotted line. The third TabItem draws text with a drop shadow, but the foreground text has a white interior and is outlined with black. The following application-definition file completes the project.
When you use these text outlines, it's important to keep the text reasonably large. Remember that these are only the bare, unhinted outlines, and they will degenerate considerably at smaller sizes. |

EAN: 2147483647
Pages: 72