Integrated Report Designer
One of the more exciting integration benefits of Crystal Reports and Microsoft development environments is the Integrated Report Designer. This feature was originally introduced with the Report Designer Component and Visual Basic 6 (this is covered in Chapter 27). As Microsoft chose Crystal Reports for its integrating reporting tool in Visual Studio .NET, this capability is brought into the VS.NET environment as well. With this design tool built into the VS.NET IDE, you can perform complex report design tasks , such as adding and joining tables, adding fields, grouping records, and formatting objects, much the same way as you can with the full Crystal Reports Designer in an off-the-shelf version of Crystal Reports. When you are finished, the .RPT file you ve created or modified will exist within the project as a strongly typed report.
| Note | One of the initial decisions you ll be making is whether to create reports in the VS.NET IDE or in stand-alone Crystal Reports. While VS.NET allows you to create reports without buying a stand-alone copy of Crystal Reports, your report design choices are more limited in the Integrated Report Designer. For example, you can t simply click a Preview button to see what your finished report looks like ”you must place the report in a viewer and run the application every time you want to see any design changes. This, and other differences, may lead you to actually do most of your report design in a stand-alone copy of Crystal Reports and then add the .RPT file to your project with Add Add Existing Item. |
If you ve already worked on another report (perhaps with the full stand-alone copy of Crystal Reports or another VS.NET application), you can add it to your existing project. Simply right-click on the project name in the Solution Explorer and choose Add Add Existing Item from the pop-up menu. An open file dialog box will appear. Change the file type in the drop-down list to Crystal Report ”only .RPT files will then appear in the dialog box. Navigate to the location for your desired report and open it. It will be added to the Solution Explorer. To edit the report, simply double-click it in the Solution Explorer window. The report will appear in its own tab in the VS.NET IDE inside the Integrated Report Designer.
| Note | Adding an existing report to your project will make a copy of the report in your project folder. Any modifications you make to this report in the Integrated Report Designer won t affect the original report you chose when you added the item. |
If you wish to create a new report from scratch for design in the Integrated Report Designer, begin by selecting the project name in the Solution Explorer. Right-click and choose Add Add New Item from the pop-up menu. The Add New Item dialog box will appear. If necessary, scroll through the available items until you find the Crystal Report icon. Once you select it, a default filename will appear at the bottom of the dialog box. Either accept it or type the desired filename in before clicking Open.
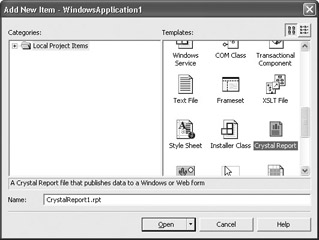
A new tab will appear in the VS.NET IDE for the new Crystal report, and the Crystal Report Gallery will appear, much as it does when you create a new report in stand-alone Crystal Reports. The Report Wizard and As a Blank Report radio buttons mimic their stand- alone Crystal Reports counterparts. However, the additional From an Existing Report choice appears only in the VS.NET Integrated Report Designer.
Choosing one of the report wizards will display the step-by-step report design dialogs discussed briefly in Chapter 1 of this book. If you choose As a Blank Report, an empty report canvas will appear in VS.NET (the Database Expert won t appear automatically, as it does when using the Blank Report option in stand-alone Crystal Reports). And, if you choose the From an Existing Report choice, an open file dialog will appear where you can navigate to an existing .RPT file to import into the VS.NET Integrated Report Designer.
Once you ve made your choices (and, in the case of a report wizard, proceeded through the necessary steps), your report will appear in the Integrated Report Designer inside the VS.NET IDE, as shown in Figure 28-2.
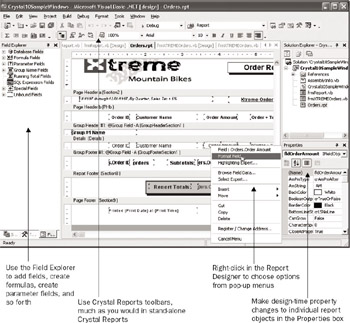
Figure 28-2: Integrated Report Designer in VS.NET IDE
Choosing a Datasource
If you are creating a new report from scratch in the Integrated Report Designer, you ll initially be presented with a blank design screen when you first create the report. As with most report design scenarios, the first step will be to choose a datasource to base your report on.
As with stand-alone Crystal Reports, this is done with the Database Expert. However, unlike stand-alone Crystal Reports, the Database Expert doesn t automatically appear when you first create a new report ”you need to display it by using a pop-up menu option. Ensure no existing report objects are selected and right-click in the report design area. Choose Database Database Expert from the pop-up menu. The Database Expert will appear.
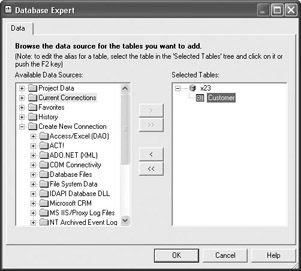
Choose the desired datasource category from the list. Note that the choice of categories (and choice of available datasource types) may vary, depending on whether you ve installed the Crystal Reports 10 Developer or Advanced Developer Edition ”additional datasources are made available when you do this. Also note that some datasources available in the stand- alone version of Crystal Reports, such as SQL Commands or Business Views stored in the Crystal Enterprise repository, won t be available in VS.NET. You will find a Project Data category, however, that will allow you to connect a report to an existing project datasource, such as an ADO.NET dataset, that has already been defined in your project.
Choose the datasource (or datasources) that you wish to use for your report. You may be required to supply logon credentials to a server to make a connection. Expand the various datasource categories once you ve connected to choose individual tables; views; stored procedures; and so forth, that you wish to use in your report. Add each desired table, view, or stored procedure to the Selected Tables list.
If you add more than one item to the Selected Tables list, the Links tab will appear in the Database Expert. Click it and link tables, as described in Chapter 16. Once you ve correctly added and linked tables, close the Database Expert by clicking OK.
Selecting Records and Adding Field Objects
Once you ve added and linked tables or other datasources, you re ready to add field objects to the actual report canvas. You should also add record selection criteria to ensure that your report will be limited to a meaningful set of data records.
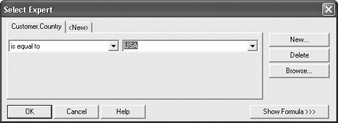
To limit the report to a certain set of records, use the Select Expert or the record selection formula. The Select Expert is displayed by right-clicking on a blank area of the report design canvas and choosing Report Select Expert from the pop-up menu. You can also click the Select Expert toolbar button in the Crystal Reports toolbar within the VS.NET IDE. If you prefer to edit the record selection formula using the Crystal formula language directly, choose Report Selection Formulas Record from the same pop-up menu as the Select Expert. The Formula Editor will appear, where you can create or edit the report s record selection formula. Record Selection is covered in detail in Chapter 8.
Add field objects to your report from the Field Explorer, which is initially docked at the left side of the report design window. These fields can consist of fields directly from your datasource, formulas that you create, parameter fields that prompt the report viewer for a value and then use elsewhere, and so forth. Expand the desired Field Explorer category and drag the desired field to the appropriate report section. You may also right-click a Field Explorer category, or an individual field, and choose options from the pop-up menu.
You can use the Field Explorer to create report formulas, parameter fields, and SQL Expressions (all are discussed in various chapters in Part I of this book). You can also drag and drop Special Fields, such as page numbers , print date and time, and so forth, to the report from the Special Fields category. The Unbound Fields category is unique to the VS.NET Integrated Report Designer. Opening this category will reveal a field type for each supported Crystal Reports data type (String, Currency, Date, and so forth). By dragging an unbound field to the report, you are merely adding a placeholder object that you ll need to fill with data programmatically at run time with a project datasource, such as an ADO.NET dataset.
| Tip | If you plan to modify your report s behavior at run time (almost a given, since you are most probably integrating a Crystal report with a custom application that will control report behavior from your own UI), you should consider using Parameter Fields to control various report behavior. By using Parameter Fields when you design your report to control record selection, report formulas, section or object formatting, and so forth, you can control report behavior at run time by passing different values to the parameter fields from within your VS.NET code. These run-time modification techniques are discussed later in this chapter. |
Formatting Objects and Sections
Crystal Reports provides default formatting for individual report objects (fields, formulas, and so forth) and report sections (page header, details, group footer 1, and so forth) when you initially create a report. However, as Crystal Reports is a complete Windows- and web- oriented design tool, you have complete control over a wide variety of properties that affect field and report section appearance.
Format individual report objects by selecting them. Then, make choices from the formatting portion of the Crystal Reports toolbars at the top of the VS.NET IDE. You may also right-click the desired object or objects and choose Format options from the pop-up menu. And, you can also select an object and make choices in the VS.NET Properties box. You ll notice some formatting options change appearance of the report right in the Integrated Report Designer. Other options, however, will only be apparent when you actually run your application and see the report in a report viewer.

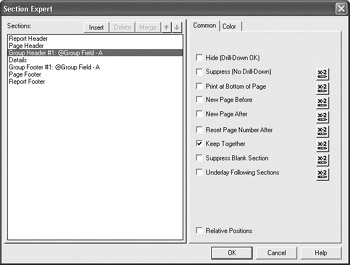
Format entire report sections (such as the Details section, Page Header, and so forth) by clicking the gray section title, right-clicking, and choosing options from the pop-up menu. In particular, you can perform all available section formatting by choosing Section Expert from the pop-up menu. This will display the Section Expert dialog box that allows control of suppression, page breaks, section background colors, and much more. Make desired choices and click OK. As mentioned previously, some of these changes ( especially conditional formatting formulas that you may supply) won t be visible until you run your application and see the report in a viewer.
| Tip | Formatting report objects is covered in Chapter 9, and section formatting is covered in Chapters 9 and 10. Refer to these chapters for detailed information on report formatting techniques. |
Sorting and Grouping
While you can just display data records one after the other in the order the database supplies them, your reports become much more powerful if you at least sort the records in a meaningful fashion by one or more relevant fields. Do this by right-clicking on a blank area of the report designer and choosing Report Record Sort Expert from the pop-up menu. You can also click the Sort Order button in the Crystal Reports toolbar in the VS.NET IDE. The Sort Order dialog box will appear.
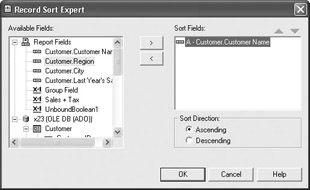
Select a desired sort field from the Available Fields list and click the right arrow to add it to the Sort Fields list. By default, the report will be sorted in ascending (A to Z) order. To change this order, select the desired field in the Sort Fields list and click the Descending radio button at the bottom of the dialog box. The report will be sorted by the chosen field in descending (Z to A) order. You are not limited to sorting the report on a single field ”add additional fields in the desired order, choosing ascending or descending sorts for each. If you need to change the priority of fields in the Sort Fields list, simply select the desired field and click the up or down arrow above the Sort Fields list to change the field s priority.
However, you may find that simply sorting the report doesn t provide sufficient flexibility for your needs. In many cases, report grouping is preferable to (or at least helpful in addition to) sorting. By creating report groups, you create level breaks that allow placement of summaries and subtotals at the end of each group. Furthermore, these grouping concepts, when used in concert with section formatting (typically hiding of report sections), become the basis for sophisticated drill-down reports that maximize the interactive capabilities of Crystal Reports placed in VS.NET applications.
To create a report group, right-click on a blank area of the report designer and choose Insert Group from the pop-up menu. You can also click the Insert Group toolbar button in the Crystal toolbars in the VS.NET IDE. The Insert Group dialog box will appear.
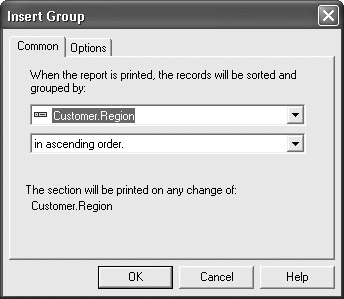
Choose the desired field on which you wish to group the report from the first drop-down list. Then, choose the order in which you want report groups to appear from the second drop-down list. If you wish to set additional group options, click the Options tab of the Insert Group dialog box and make choices. When you re finished, click OK to close the Insert Group dialog box and add the group to the report. You ll notice a group header and group footer section appear in the report for your chosen group.
| Tip | Complete details on sorting and grouping are provided in Chapter 3. |
Once you ve created necessary report groups, you can insert summary and subtotal fields in the group footers for the groups (as well as grand totals in the Report Header or Report Footer). To insert a summary, you may optionally select the field in the Details section you wish to summarize (although you don t have to). Then, right-click on the field you ve selected and choose Insert Summary from the pop-up menu. You can also click the Insert Summary toolbar button from the Crystal Reports toolbar in the VS.NET IDE (this button can be used even if you haven t selected a details field first). The Insert Summary dialog box will appear.
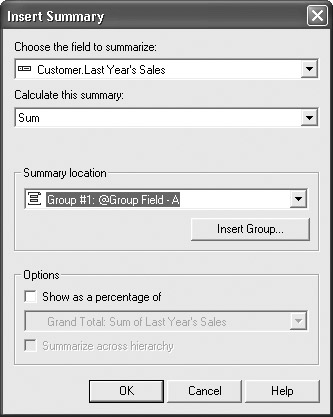
If necessary, choose the field you wish to summarize in the first drop-down list (the proper field should already appear in this list if you selected it first). Then, choose the desired type of summary (sum, average, count, and so forth) from the second drop-down list. In the third drop-down list, choose where you want the summary to be placed. Available options will be a grand total (placed in the report footer) or a subtotal placed in the desired group footer. If you wish to use a Percentage Summary Field or summarize across hierarchical groups (described in Chapter 3), check the appropriate boxes. When you click OK, the summary will be placed in the group footer or report footer.
| Note | While the user interface in the Integrated Report Designer differs somewhat from that in stand-alone Crystal Reports, the general techniques used to design reports are similar. While this chapter covers very general techniques for report design, Part I of this book covers report design techniques in much greater detail. Refer to chapters in Part I for information on various report design steps that also apply to reports designed with the VS.NET Integrated Report Designer. |
EAN: N/A
Pages: 223