Using the Report Wizards
The four standard report wizards allow you to create quick and dirty reports with minimal effort. They re helpful when you want to create a simple report or put together the beginning elements of a more complex report. Choose the wizard that most closely matches the type of report that you want to create. When you make the choice, you ll see a thumbnail view of that type of report appear in the Reports Gallery.
To create a simple general-purpose report (for example, an employee phone list or your last year s sales totals), click Standard to use the Standard Report Wizard (see Figure 1-2). The Standard Report Wizard presents a type of dialog box that s probably familiar to you if you ve used other office suites or productivity products. You build your report by choosing options from the different tabbed pages in the dialog box. You advance to the next tab by clicking the tab itself or by clicking the Next button at the bottom of the dialog box.
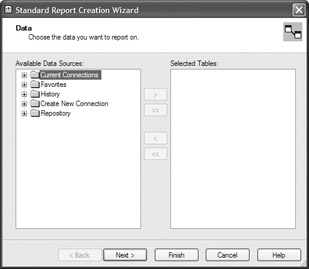
Figure 1-2: The Standard Report Wizard
To create a report with the Standard Report Wizard, follow these steps:
-
First, choose the database tables you want to use for the report using one of the categories from the Available Data Sources list. This list allows you to choose any database Crystal Reports supports, including data connections that you are already connected to from previous reports (from the Current Connections category), that you ve used recently (from the History category), and so on. If you need to connect to a database that doesn t reside in any of the initial categories, click the plus sign next to the Create a New Connection category. You ll then see a list of database types that Crystal Reports can connect to, including PC-style local databases, client/server databases (such as Oracle or Informix), Crystal SQL Queries (.QRY files), Crystal Dictionaries (.DC5 files), and many other categories (see Chapter 20 for more information on special database types).
-
As you add tables, you ll see them appear in the Selected Tables list. Once you re finished adding tables, click the Next button. You ll be taken to the Link portion of the wizard (provided that you chose more than one table). This area shows you the tables you ve chosen in a visual format, allowing you to link the tables together, based on common fields. Crystal Reports will smart-link the tables automatically, showing you lines indicating the fields and tables that are linked. If these links are correct (in the real world they rarely are), you may leave them as is.
-
If you need to delete a link that Crystal Reports added, click the line that connects the tables, and press the DELETE key to remove the existing link. If you want to delete all existing links, you may click the Clear Links button. You may then create your own link by dragging from the from field and table and dropping on the to field and table. A line will appear, indicating your new link. Once you ve linked the tables correctly, click the Next button at the bottom of the Wizard.
Tip Linking tables has quite a few fine points. Look for more information in Chapter 16.
-
Choose the database fields you actually want to appear on your report. You may choose single fields simply by clicking the field name under the Available Fields list. If you want to choose multiple fields, hold down the CTRL key and click. You ll notice that fields are multi-selected when you click them. To deselect an already selected field, hold down CTRL and click the field name again. To select a range of fields, click the first field in the range. Then, hold down the SHIFT key and select the last field in the range. Both fields, plus all fields in between, will be selected. Then, click the right-arrow button to move your selected fields to the Fields to Display box. If, per chance, you would like to add all fields from the tables to the report, click the double-right arrow.
-
To search for a particular field (in case the tables you chose contain many fields), click the Find Field button under the Available Fields list. You can enter a full or partial field name to search for. If that field is in any tables in the Available Fields list, the field will be highlighted. If you select a field in the field list and then click the Browse Data button, you ll see a sample of actual data from that database field. This may be helpful in determining whether or not this is the correct field to add to your report.
-
If you d like to change the order in which the fields appear on the report, you can make those changes in the Fields to Display box by choosing the field you want to move and clicking the up or down arrows above the list. When you re finished, click Next to move on.
Tip This is all the information the Standard Report Wizard needs to display the report. From this point forward, if you don t want to specify any other report features, such as grouping, totaling , charting, or record selection, you may click the Finish button to display the report.
-
If you wish to have your report contain report groups, choose one or more fields from the Available Fields list on the Group portion of the wizard and click the right-arrow button. Grouping puts all report records together on the report whose chosen grouping fields are the same. Grouping is similar to just sorting records, but groups can have subtotals, counts, averages, or other summaries at the end. Grouping is covered in more detail in Chapter 3.
-
If you choose to group the report, the Next button will then display the Summaries section where you ll add an entry in the Summarized Fields list for every group you created previously. This is where you choose subtotals, averages, counts, or other summaries that you want to appear at the end of the group. Crystal Reports assumes that you wish to create sum summaries for any numeric fields you ve placed on your report. You ll notice that these have already been added. You may leave these as-is, change the type of summary by selecting the summary field and choosing from the drop-down list at the bottom of the wizard, or delete the summaries by selecting them and clicking the left arrow. To add new summaries, begin by clicking on the group that you wish to create a summary for in the Summarized Fields list. Then, click the field in the Available Fields list that you wish to summarize for that group and click the right-arrow button. The wizard will choose a default summary type (such as Sum or Maximum) and display it below the Summarized Fields list. If you wish to change the type of summary for the field you just added, choose the different summary function from this drop-down list. Note that you ll see more limited summary types for nonnumeric or noncurrency fields.
-
Clicking Next will display the Group Sorting area of the wizard ( assuming that you have summary fields on your report). Usually, any groups on your report are presented in alphabetical order (for example, Arizona precedes California, followed by Oregon, Texas, and Wyoming). However, if you want to see the top or bottom five states in order of sales, select the appropriate radio button to show groups in order of the subtotal or summary amount that you choose in the drop-down list, rather than by the name of the group. Click the Next button.
-
The Chart area lets you show your report data graphically in a bar, line, or pie chart. If you choose one of these options, specify the title for the chart, and the fields that the chart should be based on and should use for the size of the bar, wedge , or line. Do this with the Chart Title, On Change Of, and Show options. Chapter 12 explains charting options in more detail.
-
When you click Next, the Record Selection area of the wizard will appear. Use this to limit your report to a limited set of meaningful database records. You likely won t ever want to include every record in the database tables in your report. Many tables contain large numbers of records, and your reports will be much more meaningful if they contain only the relevant set of records. Choose one or more fields to select, and move them to the Filter Fields list by clicking the right-arrow button. When you click a field in the Filter Fields list, an additional drop-down list appears below. You can choose the comparison operator you need in the pull-down list (such as equal to, less than, one of, between, and so on). Then, choose the value you want to compare against in the additional drop-down lists that appear. You may type a comparison value directly in the drop-down list box, or you can click the down arrow in the box to choose from a sample of data that will be read from the database field.
Tip More detailed information on selecting records is contained in Chapter 8.
-
Click Next to show the final area of the wizard, the Template area. This area lets you determine the general appearance of your report. When you choose one of the available templates, a thumbnail view of the template appears to the right. If you wish to use an existing Crystal Report .RPT file as a template, click the Browse button to locate that .RPT file. Once chosen, the thumbnail view of that report will also appear to the right.
You may now click the Back button if you wish to move backward through the wizard to make any changes. Once you re satisfied with all your choices, click Finish to show the entire report in the Preview tab.
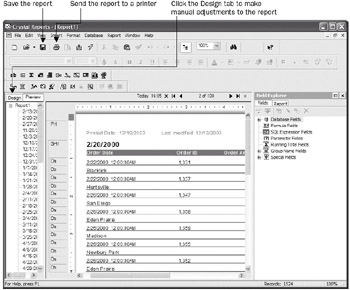
Once you have created the report using the Standard Report Wizard, you can print it on a printer, export it to another file format, save it to the Crystal Reports .RPT file format, or use any other function that Crystal Reports provides. You can click the Design tab to make any manual adjustments to the report that you wish.
| Caution | Crystal Reports will not allow you to rerun the Report Wizard to make changes to the report you ve already created ”you must use the Design tab and make manual adjustments. While the Report Wizard does make quick and dirty reporting easier than manually creating reports, you ll probably want to familiarize yourself with general report formatting options in the Design tab so that you can modify reports you create with the wizard. |
EAN: N/A
Pages: 223