The ThreadMonitor Application
This section uses the ThreadMonitor application to investigate managed and unmanaged threads running within a process. If you load the ThreadMonitor solution into Visual Studio and execute it by pressing F5, you can see the application's user interface as shown in Figure 14-5.
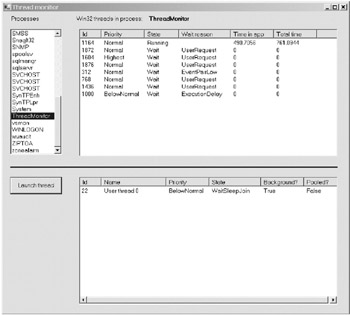
Figure 14-5: The user interface of the ThreadMonitor application
The list box on the left side of the form contains a list of the processes that are currently executing on the local machine. When you click any process, its managed and unmanaged threads are shown in the form's top list view. This list of threads is updated every second and shows details about each thread's priority, state, and processor time.
Clicking the command button underneath the list box allows you to launch a user thread. Each thread sleeps for 5 seconds and then executes a simple loop 30 million times before terminating. You can track the user threads because they're shown in the form's bottom list box as well as in the top list box.
Listing 14-9 shows the code that uses the Process.Threads collection to enumerate all of the Win32 threads within the selected process and display each of them in the top list box. Unfortunately, there's no direct way of knowing which of these process threads is managed and which isn't. There isn't even a guarantee that a single managed thread actually maps to a single Win32 thread, because the CLR explicitly declines to make any such guarantee. In the future, the use of thread fibers may allow multiple managed threads to run on a single Win32 thread.
| |
Private Sub UpdateWin32ThreadDisplay(_ ByVal SelectedProcessId As Integer) Dim SelectedProcess As Process Dim ThisThread As ProcessThread, LV_item As ListViewItem 'Get Win32 threads for this process and display them SelectedProcess = _ Process.GetProcessById(SelectedProcessId) LabelThreadName.Text = SelectedProcess.ProcessName With Me.ThreadList .BeginUpdate() .Items.Clear() 'Iterate through every Win32 thread in this process For Each ThisThread In SelectedProcess.Threads Try 'Add thread id LV_item = _ New ListViewItem(ThisThread.Id.ToString) 'Add thread details With LV_item.SubItems 'Thread priority .Add(ThisThread.PriorityLevel.ToString) 'Thread state .Add(ThisThread.ThreadState.ToString) 'Reason for thread wait If ThisThread.ThreadState = _ Diagnostics.ThreadState.Wait Then .Add(ThisThread.WaitReason.ToString) Else .Add(vbNullString) End If 'Thread time in app .Add _ (ThisThread.UserProcessorTime.TotalMilliseconds.ToString) 'Thread time in OS .Add _ (ThisThread.TotalProcessorTime.TotalMilliseconds.ToString) End With 'Display the thread .Items.Add(LV_item) Catch Exc As InvalidOperationException 'Thread's disappeared - ignore End Try Next ThisThread .EndUpdate() End With End Sub
| |
If you choose the ThreadMonitor process in the list box, you can see that it contains no less than eight Win32 threads. If, however, you use Ctrl+Break to break into the program and then examine the Threads window, you'll see only two threads displayed. Make a note of the thread ID of each of the two threads shown, and then resume program execution with F5. You can use the thread IDs to locate these two managed threads in the top list box. The first thread is usually the application's main thread and will normally be the first thread in the Process.Threads collection, although this is also not guaranteed . The second thread shown in the Threads window is the thread that runs the message pump for the Windows Form that's being displayed.
Listing 14-10 shows the code that uses the collection of managed user threads to display every user thread in the bottom list box. This collection is maintained by the code every time a new user thread is launched or terminates. Keeping this collection solves the problem of trying to figure out which Win32 thread corresponds to which user thread. The reason for keeping track of these threads is that a managed thread object has some useful information about the thread that the standard process thread object doesn't have. Some of this extra information is displayed in the list box, including the thread name , whether it's a foreground or background thread, and whether the thread is running in the managed thread pool.
| |
Private Sub UpdateUserThreadDisplay() Dim ThisThread As Threading.Thread, _ LV_item As ListViewItem 'Iterate through managed threads for current process With Me.ManagedThreadList .BeginUpdate() .Items.Clear() 'Iterate through every thread in this process For Each ThisThread In UserThreads If ThisThread.IsAlive Then Try 'Add thread id LV_item = New ListViewItem _ (ThisThread.GetHashCode.ToString) 'Add thread details With LV_item.SubItems 'Add thread name .Add(ThisThread.Name) 'Thread priority .Add(ThisThread.Priority.ToString) 'Thread state .Add(ThisThread.ThreadState.ToString) 'Thread is alive? .Add(ThisThread.IsAlive.ToString) 'Background thread? .Add(ThisThread.IsBackground.ToString) 'Threadpool thread? .Add _ (ThisThread.IsThreadPoolThread.ToString) End With 'Display the thread .Items.Add(LV_item) Catch Exc As Threading.ThreadStateException 'Thread's disappeared - ignore UserThreads.Remove _ (ThisThread.GetHashCode.ToString) End Try Else 'Thread's dead - remove from collection UserThreads.Remove _ (ThisThread.GetHashCode.ToString) End If Next ThisThread .EndUpdate() End With End Sub
| |
To launch and watch a user thread, click the "Launch thread" button once. A single managed thread will appear in the bottom list box, with its state set to WaitSleepJoin . After 5 seconds, the state will move to a state of Running , and then a few seconds later the thread will terminate and disappear from the display.
If you launch three threads in quick succession and then quickly press Ctrl+Break to pause the program, you can use the Threads window to examine these user threads. The thread name allocated by the code to each thread as it's launched is shown in the second column of the window. The active thread is shown with a yellow arrow next to it. To select another thread as the active thread, simply double-click it.
One interesting facility that the Threads window gives you is the ability to "freeze" or "thaw" a thread. To freeze a thread, right-click it in the Threads window and select the Freeze menu item. This prevents execution of that thread after you resume the program, which can be very useful if you want to examine the behavior of a single thread without worrying about side effects caused by other threads. To thaw a thread, right-click the thread again and select the Thaw menu item. This allows execution of that thread once the program has been resumed. Two blue bars next to a thread in the Threads window means that the thread has been frozen. Of course, this thread freezing and thawing is just a debugger artifact, and it doesn't mean anything to Windows itself. If you took away the debugger from a frozen thread, it would continue execution normally.
EAN: 2147483647
Pages: 160