Control Charts
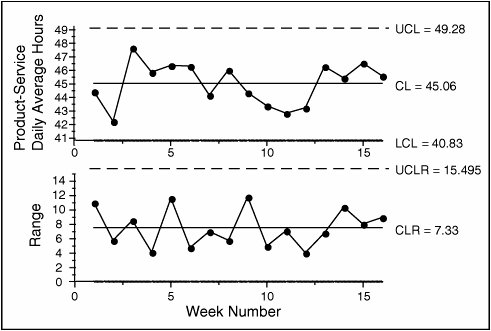
| Control charts are among the most important quality tools. They have been used extensively in a variety of manufacturing industries as part of SPC. Control charts were introduced by Walter Shewhart of Bell Laboratories and were strongly supported by Deming while he was in Japan and subsequently the United States. Deming believed control charts were an indispensable tool of process improvement. Conceptually they are pretty straightforward. SPC concedes that every process has variation. The key to managing a process effectively and efficiently is to measure its variation periodically to check whether it is within the acceptable limits. Processes whose variation is within such limits are said to be "in control." "Out-of-control" processes lead to defective work, with adverse cost, quality, and schedule implications. SPC deploys control charts to prevent defective work from being produced by focusing efforts on the process quality rather than the final product. Thus, it lets the enterprise take preventive and process improvement initiatives rather than just appraising the final product. There are many types of control charts,[8] but all are characterized by two statistically determined control limits: the upper control limit (UCL) and the lower control limit (LCL), which define the upper and lower limits of deviation, respectively. Control charts require some 100 data points to calculate UCL and LCL but only periodic small subgroups to continue monitoring the process. Control charts for attributes data require 25 or more subgroups to calculate UCL and LCL. A process in statistical control has most of the data points distributed randomly around the mean. Control limits are determined statistically such that there is a high probability (normally greater than 99%) that data will fall between these limits if the process is in control. Although all types of charts can be used to measure the software process, XmR charts and average (X-bar) and range (R) charts have been found to be the most useful, according to Florac and Carleton (Figures 6.14 and 6.15).[9] This reference provides a step-by-step presentation of implementing statistical process control in the software development process. We consider it an excellent resource on the subject. Figure 6.14. XmR Charts for Unresolved Critical Problem ReportsW. A. Florac and A. D. Carleton, Measuring the Software Process, p. 101, Fig. 5.16. © Pearson Education, Inc. Reprinted by permission of Pearson Education, Inc. All rights reserved. 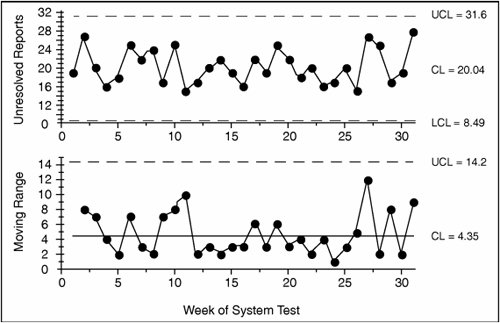 Figure 6.15. X-Bar and R Charts for Daily Product Service EffortW. A. Florac and A. D. Carleton, Measuring the Software Process, p. 89, Fig. 5.4. © Pearson Education, Inc. Reprinted by permission of Pearson Education, Inc. All rights reserved. This chapter has presented the seven basic tools of quality (B7) in a software development context. These tools provide problem-solving/process-improvement capabilities to DFTS technology in addition to design capabilities. B7 tools can be of great value in project management, inspection and testing, and analyzing software metrics. Statistical tools generally are of relatively limited use in upstream design phases given the lack of volumetric data. But as you have seen, not all the tools are quantitative, not even the most frequently used B7 tools such as cause-and-effect diagrams. These are equally applicable to and used in upstream phases. It is important to use them in the wider context of DFTS technology, which includes a number of quality methodologies, such as QFD, TRIZ, Pugh, Taguchi Methods, and FMEA. Additionally, techniques such as systems thinking, process management, standardization, and adequate documentation, which are integral parts of DFTS technology, must be included in process improvement. This chapter introduced B7 in a software development context and is a precursor to Chapter 15, which discusses quality measures and statistical methods for trustworthy software. |
EAN: 2147483647
Pages: 394
- Step 1.1 Install OpenSSH to Replace the Remote Access Protocols with Encrypted Versions
- Step 3.4 Use PuTTYs Tools to Transfer Files from the Windows Command Line
- Step 4.1 Authentication with Public Keys
- Step 4.6 How to use PuTTY Passphrase Agents
- Step 6.2 Using Port Forwarding Within PuTTY to Read Your E-mail Securely