Graphs
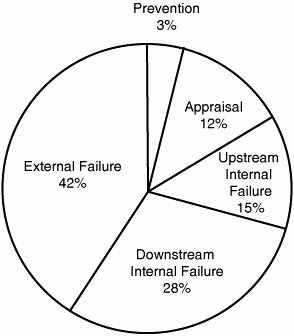
| Graphs are useful tools in software quality and project management. Among the most commonly used graphs are run charts, pie charts, and bar charts (see Figures 6.11, 6.12, and 6.13). They help you monitor time variation and understand causes of defects in a process. Control charts, discussed next, are based on run charts. They constitute the most fundamental tool of statistical process control. Process data can be analyzed using graphs plotted with statistical tools such as Minitab or Microsoft Excel. Figure 6.11. A Run Chart of the Number of Defects Reported Over Time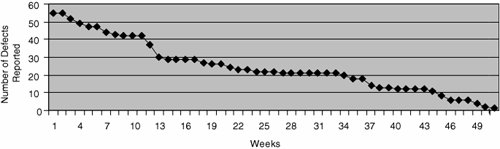 Figure 6.12. A Pie Chart of Costs of Quality Figure 6.13. A Bar Chart of Costs of Quality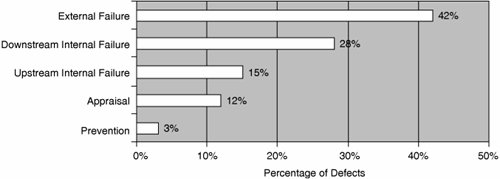 |
Design for Trustworthy Software: Tools, Techniques, and Methodology of Developing Robust Software
ISBN: 0131872508
EAN: 2147483647
EAN: 2147483647
Year: 2006
Pages: 394
Pages: 394
Authors: Bijay K. Jayaswal, Peter C. Patton