Scatter Diagrams
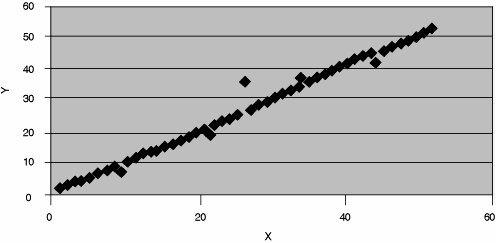
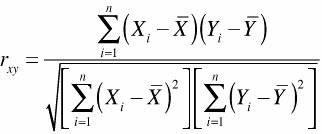
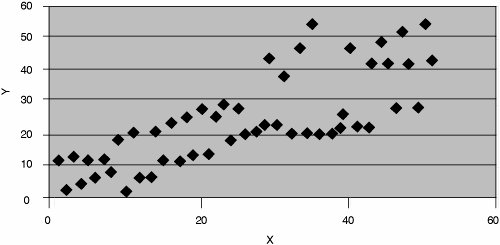
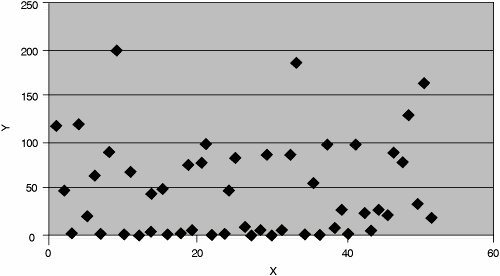
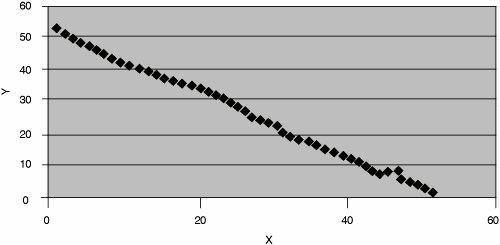
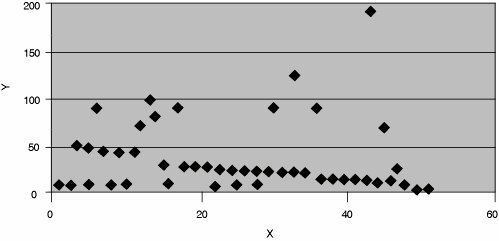
| A scatter diagram seeks to establish whether a relationship exists between two variables, and the strength of the relationship (if there is one). Establishing relationships can be particularly useful in cause-and-effect analysis. Typically, the variables in questionthe independent variable (x) and the dependent variable (y)represent cause and effect. A strong correlation may help identify possible countermeasures to address a particular quality problem. But a strong correlation is insufficient to establish a relationship. Common sense must never be abandoned to avoid establishing associations that may be pure coincidence. Figure 6.7a illustrates a number of scatter plots. Exhibit 6.7(a). Positive correlation Although scatter diagrams provide a strong visual display of the relationship between two factors, they do not provide any formal measurement of the strength. Nor can they explain that any apparent visible relationship may be just coincidence. A formal, albeit indirect, measurement of linear association is provided by the correlation coefficient. It measures the strength of the linear relationship between two random variables and is defined as follows: The value of rxy must be between 1 and +1, inclusive. +1 represents a perfect positive correlation if all the points in the plot fall on a straight line that has a slope of 1. Similarly, -1 represents a perfect negative correlation. But rxy = 0 (see Figure 6.7c) does not mean that there is no relationship, just that there is no linear relationship. Figures 6.7a and 6.7d represent strong positive and negative correlations, respectively. Figures 6.7b and 6.7e indicate the possibility of comparatively weak positive and negative correlations, respectively. Exhibit 6.7(b). Positive correlation may exist Exhibit 6.7(c). No correlation Exhibit 6.7(d). Negative correlation Exhibit 6.7(e). Negative correlation may exist Scatter plot analysis normally should be deployed only after cause-and-effect brainstorming has already identified a possible association. As such, the plots and correlation coefficients constitute confirmatory analysis. If a strong positive or negative correlation exists, causal factors can help identify strong countermeasures. Weaker associations, on the other hand, can be used for taking additional measures for process improvement, in risk analysis and Robust Design as required. |
EAN: 2147483647
Pages: 394