6.12. Brightness and Contrast Sliders
| < Day Day Up > |
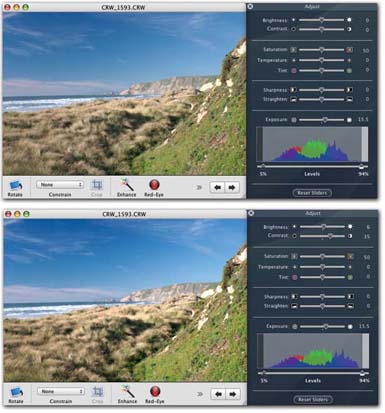
6.11. Adjusting the LevelsAfter you've spent some time working with the middle tones of your picture, you can turn your attention to the endpoints on the histogram, which represent the darkest and lightest areas of the photo. If the mountains of your graph seem to cover all the territory from left to right, you already have a roughly even distribution of dark and light tones in your picture so you're probably in good shape. But if the graph comes up short on either the left (darks) or the right (lights) side of the histogram, you might want to make an adjustment. To do so, drag the right or left pointer on the Levels slider inward, toward the "base" of the "mountain" (Figure 6-8). If you're moving the right indicator inward, for example, you'll notice that the whites become brighter, but the dark areas stay pretty much the same; if you drag the left indicator inward, the dark tones change, but the highlights remain steady.
Tip: Instead of dragging these handles inward, you may prefer to simply click the slider track itself at the outer base of the mountain. That's faster and gives you better control of the handle's landing point. In general, you should avoid moving these endpoint handles inward beyond the outer edges of the mountains. Doing so adds contrast, but also throws away whatever data is outside the handles, which generally makes for a lower quality printout. |
| < Day Day Up > |
- Using SQL Data Manipulation Language (DML) to Insert and Manipulate Data Within SQL Tables
- Understanding SQL Transactions and Transaction Logs
- Using Keys and Constraints to Maintain Database Integrity
- Writing External Applications to Query and Manipulate Database Data
- Repairing and Maintaining MS-SQL Server Database Files