Reporting Services Components
SQL Server 2005’s new Reporting Services system consists of a variety of interrelated components. In this section, you’ll get a closer look at each of those components, beginning with the part that has the most visibility: the Report Designer.
Report Designer
The Reporting Services Report Designer enables you to visually design reports as well as control their deployment. Unlike the Reporting Services add-on for SQL Server 2000, which required Visual Studio in order to design reports, SQL Server 2005’s Reporting Services provides the Report Designer as part of the Business Intelligence Development Studio. To start the Report Designer, you first open up SQL Server 2005’s Business Intelligence Studio and then select the File | New | Project | Report Project option to create a new Report Services project. Then, to open the Report Designer, you select the Project | Add New Item | Report option. You can see an example of the Reporting Services Report Designer in Figure 8-2.
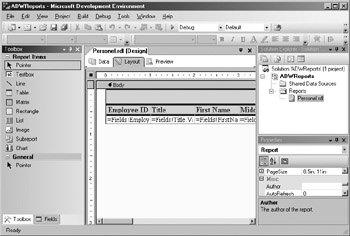
Figure 8-2: Reporting Services Report Designer
Toolbox
The Toolbox window in the Reporting Services Report Designer is shown on the left side of the screen in Figure 8-2. The Toolbox is used to drag and drop components onto their respective design surfaces.
Report Controls
The Report Design Toolbox contains the following controls:
-
Textbox The Textbox control enables you to display textual data on your report. The textbox can be placed anywhere on the report and can contain column data, labels, and calculated fields.
-
Line The Line control enables you to draw a line on the report layout.
-
Table The Table control enables you to bind a table to the report layout.
-
Matrix You can use the Matrix control to display a grid on the report layout. You can bind the Matrix control to the report’s dataset.
-
Rectangle The Rectangle control is primarily used as a container for other report elements. It can also be used as a graphical element by the Line control.
-
List The List control enables you to place a list on your report layout. The list can be bound to fields in your dataset.
-
Image The Image control enables you to bind binary images to the report layout. The supported formats are: bmp, jpg, gif, and png.
-
Subreport The Subreport control is used to link a section of the report to another previously defined report. The Subreport can either be a stand-alone report or be expressly designed to run within another report.
-
Chart The Chart control draws a chart on the report layout. The Chart control can be bound to the report’s dataset and supports a large number of different chart types, including: columns, bar, line, pie, scatter, bubble, area, doughnut, radar, stock, and polar.
Design Surface
In the center of the screen in Figure 8-2, you can see the Report Designer’s Design Surface. The Report Designer’s Design Surface is where you create the layout of your report. The Design Surface presents three tabs: Data, Layout, and Preview. To create a report, you must first define a dataset, and you can do that using the Data tab. The dataset is built by specifying the database connection either by manually entering the appropriate connection string or by filling in the prompts displayed in the Data Link dialog. Once the connection is set up, you then define your query either by entering the SQL statement or by using the graphical Query Designer. The Query Designer enables you to visually build a SQL query by dragging and dropping tables and then selecting the desired columns and visually defining any required join and row selection criteria. Once the query has been designed, a graphical query builder representation of that query will be shown on the Data tab.
The Layout tab is where you design your report. You design the report by dragging and dropping items from the Toolbox onto the Layout pane and then moving and resizing them. As you can see in Figure 8-2, the Layout pane shows all of the Reporting Services controls that have been added to the report as well as their bindings.
The Preview tab allows you to preview what the rendered report will look like. When you click the Preview tab, the Report Designer will execute the report and display it in the Preview tab. The Preview doesn’t allow you to make changes to the way the report looks. In order to change the report, you need to use the Layout tab.
Solution Explorer
You can see the Report Designer’s Solution Explorer in the upper right-hand corner of Figure 8-2. The Solution Explorer provides a hierarchical tree view of the different projects and files that are included in a Business Intelligence Development Studio solution. The top item in the Solution Explorer hierarchy is the solution name. In Figure 8-2, you can see the solution is called ADWReports. Under the solution, you can have one or more projects. In Figure 8-2, you can see that in this example the solution has one Reporting Services project, called reports, and that under that project is a report named Personel.rdl. Each Report Services project can contain multiple reports.
Properties
You can see the Report Designer’s Properties window in the bottom-right corner of Figure 8-2. The Properties window can be used to set the attributes of the report layout items at design time.
Fields
The Report Designer also provides a Fields window that shows the contents of the dataset that’s in use. You can drag and drop fields listed in the Fields window onto the Report Designer’s design surface to include them in the report. You can see the Fields window in the upper-left corner of Figure 8-3.
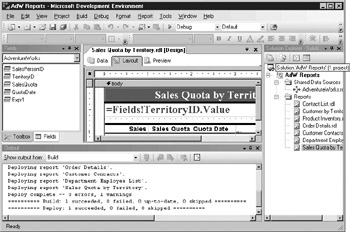
Figure 8-3: Report Designer Fields Window
You can alternate between the Fields window and the Toolbox by clicking the appropriate tab shown at the bottom of the Fields window.
Output
The Report Designer also provides an Output window that shows the results of building and deploying reports. After a report is designed, it must be built and then deployed before it can be used. The Build process creates a .NET assembly, while the Deploy process takes that assembly and installs it in the ReportServer database. The result of these actions is shown in the Output window that you can see in the bottom of Figure 8-3.
OLAP Report Designer
Much as the Reporting Services Report Designer enables you to design reports for relational databases, the OLAP Report Designer enables you to design reports for Analysis Services databases. Depending upon the type of data source that you select, the Report Designer will automatically open either as the relational Report Designer just described or as the OLAP Report Designer. If the data source that you choose is an ODBC, OLE DB, or Native SQL Client data source, then the relational Report Designer that was shown earlier in Figure 8-3 will be opened. If the data source that you choose is a Microsoft SQL Server for Analysis Services data source, then the new OLAP Report Designer that’s shown in Figure 8-4 will be opened.
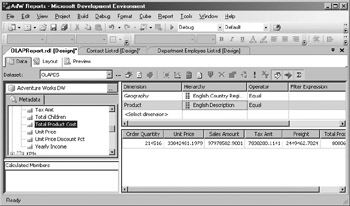
Figure 8-4: OLAP Report Designer
The OLAP Report Designer is optimized for building reports based on Analysis Services cubes. Instead of showing tables and columns, the designer shows you the cubes metadata that you can use to build your reports.
Metadata
On the left side of Figure 8-4, you can see the OLAP Report Designer’s Metadata window. The Metadata window lists all of the cube’s attributes. At the top of the list, you’ll find the cube’s measures, followed by the KPIs and then all of the different dimensions. You can drag and drop fields listed in the Fields window onto the Dimensions and Measures panes.
Dimensions Pane
Shown in the upper-right portion of Figure 8-4, the Dimensions pane is used to specify all of the dimensions that are to be used in the report. To add a dimension to the Dimensions pane, you simply drag the desired dimension for the Metadata window and drop it onto the Dimensions pane.
Measures Pane
The OLAP Report Designer’s Measures pane is shown in the bottom portion of Figure 8-4. You use the Measures pane very much as you do the Dimensions pane, by dragging and dropping measures from the Metadata window into the Measures pane. The OLAP Report Designer automatically builds the headers across the top of the Measures pane and fills in the rest of the pane with the appropriate data values from the cube.
Report Server
The Report Server is the primary rendering and distribution engine for Reporting Services. The Report Server consumes the Report Definition Layout (RDL) files that are created by the Report Designer and renders the report into the desired output format. In addition to rendering reports, the Report Server also handles the security and distribution of the reports. Figure 8-5 presents an overview of the functionality provided by the Reporting Services Report Server.
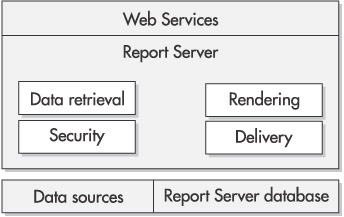
Figure 8-5: Report Server overview
The Report Server is an ASP.NET-based application and exposes an HTTP SOAP endpoint that’s used to manage and access the server. The Report Server is the heart of SQL Server 2005’s Reporting Services and handles all of the essential report generation and distribution tasks. When a user requests a report or a report is deployed to an end user, the Report Server checks the report’s security attributes to ensure that the user has permissions to both the report itself as well as the database objects that are used by the report. If the user has the required permissions, then the Report Server will retrieve the report definition from the ReportServer database and render the report according to the format specified in the RDL. As the report is rendered, the Report Server will access all of the required data sources, retrieve the data, and build the report. Once the report has been created, the Report Server handles distributing the report to all of its predefined delivery targets. The Report Server caches the retrieved results in an intermediate format for a predefined amount of time. This caching is a terrific feature for scalability, as it enables repeated requests for the report to be processed very quickly. When the reports are cached, all of the required data retrieval and rendering steps have already been completed and the Report Server simply needs to distribute the cached report to the end user.
Report Delivery
One of the key points in creating your reporting solution is to define how the reports will be delivered to the end users. Report Server is responsible for the delivery of reports and supports pull-style on-demand reports as well as push-style and subscription-based delivery options.
-
On-demand delivery Reporting Services provides two types of on-demand report delivery: URL-based report access and web services–based report access. With URL access, the end user either directly enters a URL into the browser or clicks a link to access the Report Server. Any required parameters are passed in as part of the URL. Report Server will render the report in HTML format in the user’s browser. End users can also access reports by issuing SOAP requests to the Reporting Services Report Server. In this scenario, the user would typically select an option from their application that actually submits the SOAP request. One advantage to this method is that SOAP provides discovery methods that enable the application to dynamically discover any required report parameters. As you’ll see in the next section, Reporting Services SOAP access isn’t limited to just delivering reports. It also provides full access to the Reporting Services management functions.
-
Subscription delivery In addition to pull-style report delivery, Reporting Services also supports push-style subscription delivery. In contrast to pull report delivery, where the user initiates the report generation, with subscription-based push-style report delivery, the Report Server engine delivers reports to end users according to a predefined schedule. Subscriptions can be based on times or can be data driven. For instance, you can configure Report Server to deliver a given report or set of reports at the end of the day, week, or month. To deliver reports on a timed schedule, Reporting Services uses the SQL Agent. Data-driven subscriptions are different from regular subscription in that data-driven subscriptions acquire their subscription information at run time. Data-driven subscriptions are designed to handle situations where the report recipients can change between different runs of the report. Both on-demand and subscription-based delivery mechanisms share the same report output options.
Report Manager
As its name suggests, the Report Manager is the primary tool for managing Reporting Services reporting solutions. The Report Manager is an ASP.NET web-based application and is accessed by pointing your web browser to http://<servername>/Reports. You can see the Report Manager in Figure 8-6.
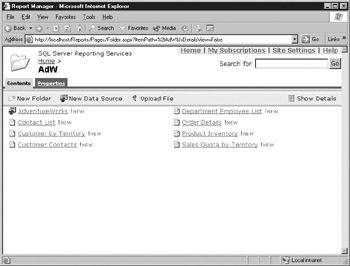
Figure 8-6: Reporting Services Report Manager
If you’ve used Sharepoint, then you’ll no doubt notice a distinct similarity between the Reporting Services Report Manager and a Sharepoint site. Both share a very similar look and feel. The Report Manager enables you to view and manage all of the reports that have been deployed to the Report Server. You can edit the data sources and connection strings used by the reports and modify the various report properties. In addition, the Report Manager enables the Reporting Services Administrator to set up the security and subscriptions for the reports that can be accessed using Reporting Services.
Report Builder End User Reporting Client
For an enhanced end-user reporting experience, Reporting Services will also include Report Builder which is based on the ActiveViews technology. Microsoft acquired the Report Builder technology in 2004 from the company ActiveViews. The inclusion of Report Builder gives SQL Server 2005 a web-based report authoring an end-user query tool. Report Builder directly addresses the problem of unending user report requests by providing a tool that enables end users to author their own reports. Report Builder is based on Microsoft’s .NET framework and has been designed from the outset to be completely integrated with Reporting Services. The Report Builder end-user reporting tool is simple to use; the details of the reports can be viewed directly in the Report Builder window as the report is being created. After the Report Builder reports have been authored, they can be deployed in a browser just like any other Reporting Services report.
EAN: 2147483647
Pages: 80