PRODUCE THE PROJECT SCHEDULE
As you make progress with the definition of the detailed-level requirements, you will be able to start the production of a project schedule. Project schedules are normally produced as Gantt charts. These charts deliver a wealth of information in a simple graphical format. It is likely that anyone managing an advanced project will already be familiar with them. The chart is constructed in four steps:
-
framework;
-
activity bars;
-
inter-activity dependencies;
-
add risk mitigation.
These are identified in Figure 3.8.
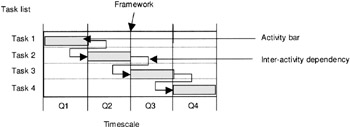
Figure 3.8: Identification of Gantt chart components
Framework
The framework is the mesh of horizontal and vertical lines that form the background of the Gantt chart. The lines create a series of boxes, each of which represents a unit of time. The time line is shown on the horizontal axis at the bottom of the chart. Initially you can set timescale to any arbitrary interval since it will almost certainly change as planning progresses. The timescale shown in Figure 3.8 is set at quarterly intervals since this is a commonly used timescale in advanced projects. If you are using a computer package to generate the chart, adjusting the timescale should be very easy.
The left-hand vertical axis shows the activity list, which is running top to bottom and is labelled from task 1 to task 4. When producing your schedule you should try to use activity descriptions that are meaningful. Ideally all descriptions should be clear, unambiguous and simple. Although in practice this might be difficult to realize fully, it is nevertheless worth while taking some time in the development of the activity names . For example, ˜Lay building foundations' or ˜Write software test plan' both give a clear indication of the purpose of the activity. If you are producing the Gantt chart using a computer package it is likely that you will be able to annotate the various tasks . These annotations to the activities will enable you to expand on the purpose and meaning of the task.
Activity bars
Activity bars are the backbone of Gantt charts. It is these horizontal bars that show where a task begins and ends. Their visual simplicity hides the amount of information that they present to a knowledgeable reader. Once the framework has been fully populated with activity bars and their inter-dependencies it will hold the majority of the key information needed for analysis and management of the project.
At this stage in the project you should have received from your work package managers a series of tasks along with their time-scale, inter-dependencies and resource needs. You should now populate the framework with only the tasks. If you are using a computer package you will be able to group like tasks together. For example, you might group all of the related work package activities together under one heading. You should quite quickly be able to generate a chart similar (but with many more activities) to the one shown in Figure 3.8 but without the inter-dependencies.
The chart that you have created will now give you a general feel for the likely schedule for the project. However, there is still a substantial amount of work required to enable you to achieve a completed Gantt chart. The next stage in the chart's development is to add the inter-activity dependencies.
Inter-activity dependencies
Adding inter-activity dependencies will link together related tasks. The links are normally shown on a chart as an arrow going between the related activities. There are three inter-dependency types: finish to start, start to start, and finish to finish. The three different types of dependency are shown in Figure 3.9(a), Figure 3.9(b) and Figure 3.9(c).
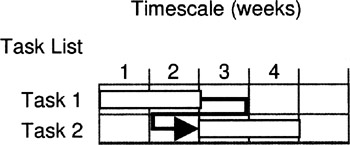
Figure 3.9(a): Finish to start
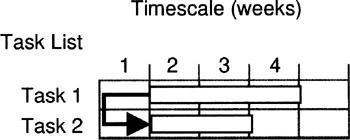
Figure 3.9(b): Start to start
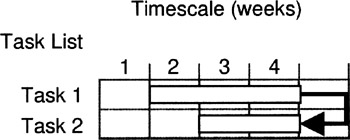
Figure 3.9(c): Finish to finish
Finish to start, Figure 3.9(a), is the most common type of inter-activity dependency. It indicates that one task must complete before another can start. In start to start inter-activity dependency, Figure 3.9(b), the tasks involved both must start at the same time; however, this does not imply that the completion of the tasks is synchronized. In finish to finish relationships, Figure 3.9(c), the tasks must complete at the same time. This does not imply that the start of the tasks needs to be synchronized. Often the relationship is not clear and as a result there are two variations that can be used: dependencies with lag time, and partial dependencies. These are shown in Figure 3.10(a) and Figure 3.10(b).
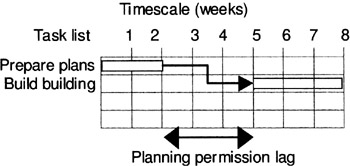
Figure 3.10(a): Finish to start with lag
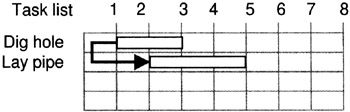
Figure 3.10(b): Start to start with lag
You would use an inter-dependency with lag time when a period of time needs to occur between one activity completing and another starting. The example shown in Figure 3.10(a) is when a project needs to obtain planning permission. The request for permission is prepared and agreed with the architect and then the plans are submitted for planning approval. Waiting for the approval takes a number of weeks. During this time it is incorrect to show any project activity since there is none. However, the dependency between the tasks remains. Once approval has been given, the building work can start in earnest. Waiting for the planning permission is the lag time, time that must occur between related activities. This type of dependency is called ˜finish to start with lag'.
The second variation on inter-dependencies is the partial dependencies. This is used when a task can begin after a certain percentage of its predecessor task (the related task that occurs immediately prior to it) is completed. A simple example of this would be laying a water pipe in a 20-metre-long ditch. The two related activities are digging the ditch and laying the pipe in the ditch. Obviously you do not have to wait for the ditch to be completed before the pipe laying starts. The gang that is laying the pipe will start once a reasonable amount of the ditch has been excavated. This type of activity is called ˜start to start with lag' and is shown in Figure 3.10(b).
You should now have a Gantt chart that has the various project tasks and their inter-dependencies shown. It will be similar to but larger than the chart shown in Figure 3.11.
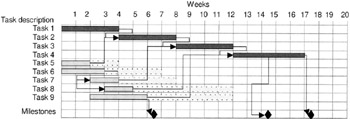
Figure 3.11: Gantt chart with inter-dependencies and float
The chart shows that task 4 is the last task to finish, finishing in week 17. The series of activities leading up to week 17 are task 1 followed by task 2 and then by task 3. These four tasks are known as the critical path of the project. The critical path of the project is a very important feature of the chart and is one that you should identify for your project. The critical path shows tasks that occur serially and immediately after one another from the start of the project until its end. All of the tasks must finish and start on time (or earlier) for the entire project to finish to its published schedule. The activities that form the critical path are known as critical tasks. Project managers normally highlight the critical path by using a different colour or shade of grey for the activities that lie on it.
Tasks that are not on the critical path have float attached to them. Technically, float is the difference between the time available for completing a task and the time required to complete the task. If a task has no float then it is on the critical path of the project. A subset of float is known as free float. This is the maximum amount of time by which a task can be delayed beyond its start date without delaying any successor task beyond its start date. Free float will only appear on tasks that have a successor that is not on the critical path.
Float is shown attached to each of the non-critical tasks shown in Figure 3.11. It is the additional bar that is visible beyond the end of the activity bar. For example, task 6 can slip by up to four weeks without affecting the end date of the project. If it slips by a further one week then it would make the project one week late. This would happen because it would make task 7 one week late, which in turn would make task 3 one week late. The greatest amount of float is attached to task 8 and is seven weeks in length. This means that it can slip by up to seven weeks without having any effect on the end date of the project
This chart is now more or less complete and if it depicted your project it would be possible to use it for managing your project. However, there are three black diamonds that have not been mentioned so far, which have been included to improve the chart's usefulness . The diamonds are used to depict project milestones, which are key points in the project's life when a major event will have been completed. For example, the event might be the completion of the requirements and functional specification. Often companies will use a formal methodology that dictates what milestone events contain. You should assess this and set some project milestones as needed.
In addition to the formal milestones it is worth while considering the addition of some interim milestones. These can be used to add additional focus for the project team to enable them to view progress as the project goes forward. The completion of these milestones is especially important on advanced projects where the distance between the formal milestones can be many months.
Add risk mitigation
All projects have a degree of uncertainty (or risk) associated with them. This can happen for various reasons, for example because the company has not undertaken similar work before. Whatever the reason for the uncertainty it is sensible to prepare for activities not delivering according to plan. A common mistake of inexperienced project managers is to believe that careful initial planning will enable them to eliminate the risk in the project. Therefore once they have completed the initial plan they see little point in expending more energy on introducing risk mitigation. However, unseen events will always occur, for example a flu epidemic may occur. So you should allow time in your plan for things to go wrong.
There are two standard methods for showing additional time in a project. The first method has already been discussed, float. The second method is called the ˜addition of contingency'. You should be careful to avoid confusing the two methods . They are very different in nature. Both can be successfully used to provide time that can compensate for things going wrong. The difference between the two is their relationship to the end date of the project. If contingency is used then the project will have slipped past its earliest possible end date. This is different to float, which is time that is available but if used won't affect the end date of the project.
Obviously both are useful but it would be unwise for you to rely on float to save your project when things go wrong. You should include contingency for each task in your project where there is a significant risk of the task not staying on its original schedule. You should add it on a task-by-task basis, allowing you to add more contingency on higher-risk tasks than on lower-risk tasks.
One difficulty that you will face when adding contingency to your project is reluctance from the project steering group. They will be keen that the project finishes as quickly as possible and as a result they will not be keen to add time that might not be needed. Often members of the steering group suggest that contingency is added in a block at the end of the project rather than on a task-by-task basis. If possible you should resist this suggestion. You should remind them that only certain tasks need contingency and that adding it at the end will seem like a licence to slip on all tasks. If contingency is added to the plan in Figure 3.11 then it will be redrawn as shown in Figure 3.12.
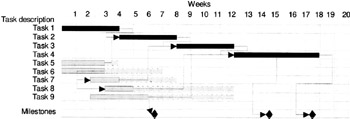
Figure 3.12: Gantt chart with contingency
One week of contingency has been added to task 4 and one week to task 5. Since task 4 is on the critical path this has resulted in a one-week slip to the end of the project. However, the addition of the contingency to task 5 has had no overall effect except reducing the duration of the float for the task.
You should now have a complete project schedule. This accompanied by the detailed-level requirements should be presented to the steering group at the next scheduled meeting. At the meeting you should inform the group that you intend that this plan form the baseline of the project. If the plan differs significantly from the macro plan already presented as part of the business case you will need to discuss the implications with the steering group members.
If the steering group approves your proposed baseline plan then you will have achieved a significant milestone in the project. This plan agreed at this milestone will be the plan against which you are measured. Although plans can and do change, this baseline will always remain as a footprint in time against which the organization will measure success. It will help the organization understand whether it is achieving what it wanted to achieve.
EAN: 2147483647
Pages: 69
- Chapter IV How Consumers Think About Interactive Aspects of Web Advertising
- Chapter VII Objective and Perceived Complexity and Their Impacts on Internet Communication
- Chapter VIII Personalization Systems and Their Deployment as Web Site Interface Design Decisions
- Chapter IX Extrinsic Plus Intrinsic Human Factors Influencing the Web Usage
- Chapter XIV Product Catalog and Shopping Cart Effective Design