Event Tracing for Windows: Debugging Without a Debugger
| While performance counters are great for discovering aggregate statistics about a Web application for planning or other purposes, they won't typically give you the detail you need to diagnose, say, a request that is taking longer than expected to complete. But there is a system called Event Tracing for Windows (ETW) that is designed to do exactly that. ETW is a high-performance tracing system implemented in the Windows kernel. It was introduced way back in Windows 2000 to help add diagnostic support to the kernel and other subsystems such as IIS and Active Directory. In recent years, the teams working on IIS, ASP.NET, Windows Communication Foundation, and other infrastructures have been working hard to instrument their code with ETW. Think for a moment about how ASP.NET tracing works. Imagine instrumenting your entire Web application using Trace statements, and then turning on tracing in a high-volume scenario where thousands of requests are being processed per minute. That's an awful lot of trace data, and it's probably going to put quite a load on your server. ETW was designed specifically to address this sort of scenario. By focusing on tight, binary trace data cached in locked pages of memory managed by the kernel, ETW tracing lets you capture high volumes of detailed data from a production server without killing that server's performance. On a production server, you can't afford to wire up a debugger to see what's wrong. ETW gives you the next best thing: it's like debugging without a debugger, as Chris St. Amand says in his webcast (you should watch this if you want to learn more about ETW).[6]
Figure 7-6 shows the output of an ETW command on Windows Server 2003 with the .NET Framework version 2.0 installed. This command lists the ETW providers that are installed by default. Figure 7-6. ETW providers on Windows Server 2003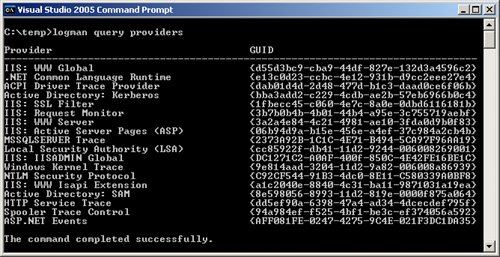 Given all of these providers, you can literally trace a Web request as it flows through IIS (using the IIS: WWW Server provider) into ASP.NET (using the ASP.NET Events provider) down into the CLR (using the .NET Common Language Runtime provider) into the kernel (using the Windows Kernel Trace provider). You can even follow the request into SQL Server using the MSSQLSERVER Trace provider. That's enough description; let's see ETW in action. The first step toward getting an ETW trace is to list the providers you want to participate in a text file (if you're only using a single provider, you can skip this step). Listing 7-19 shows an example of a provider file that includes IIS and ASP.NET. Each line in the file (besides the comment) includes a provider GUID, an integer which is really a set of provider-specific flags that turn on various tracing features for that particular provider, a second integer that indicates verbosity level, and lastly, a human-readable provider name (this name isn't strictly necessary, but it makes the file more readable). Listing 7-19. A sample provider text file
With this text file in hand, we can now start an ETW trace using the log manager (logman.exe): C:\>logman start trace mytrace -o out.etl -pf providers.txt -ct perf -ets The name "mytrace" is an arbitrary string that we'll use later to turn the trace off when we've finished gathering data. The output of the trace will go into a binary file called out.etl. The ct switch with the "perf" argument[7] tells ETW that we want to use the multimedia clock for timestamping each log record. The normal clock doesn't have a high enough resolution to be useful for ETW tracing (logman can also be used to record performance monitoring data, and it doesn't require such a high resolution clock). The ets switch is one you'll almost always want to use, as it indicates that the trace should start immediately.
Now that the trace is running, we'll surf to an ASP.NET Web page on the server, which should generate some trace data. Then we'll stop the trace: C:\>logman stop mytrace ets At this point we should have some output, shown in Listing 7-20. Listing 7-20. Output from an ETW trace
Keep in mind that the output is binary and you'll need a tool to view it. You can use the built-in TRACERPT.EXE tool to convert it into a comma-delimited file if you like. Get this: in a distributed system, you could even be running traces on multiple machines, and you could use TRACERPT.EXE to merge the trace files into one report! This is another benefit of using ETW, but it's one we'll leave you to explore on your own (be sure that the clocks on the machines from which you're collecting data are synchronized). There's another tool called Log Parser[8] that can process these comma-delimited log files, and as of this writing, the latest version (2.2) also processes binary ETW files directly. We'll use that to select some output from the ETW trace.
The first command you'll probably want to run if you were following along on your own computer would be this: C:\>logparser i:ETW "select * from out.etl" Unfortunately, the output from this is so wide that there's no way to show it to you in the book in any meaningful way. But suffice it to say that it includes an event number, name, type, timestamp, and a very long UserData field. For the purposes of this demonstration, we'll limit the selection to just a few fields, and do some serious abbreviation of the UserData, which can be quite long. Listing 7-21 shows a more reasonable query that generates output that can actually fit on the page: C:\>logparser i:ETW "select EventName, EventTypeName, UserData from out.etl" Listing 7-21. Viewing ETW trace records
Here you can see two providers at work: the IIS provider and the ASP.NET provider. Written by two entirely separate teams, they nonetheless are cooperating to provide a single trace output that shows the call stack for a request as it flows from IIS into ASP.NET and back again. There's not a lot of detail in this request, so let's tweak the providers.txt file a bit to ask for more detail from the ASP.NET provider (see Listing 7-22). Listing 7-22. Asking for more detail
This turns on all four flags that the ASP.NET provider defines (you can find this in the aspnet.mof file mentioned earlier in this chapter):
Listing 7-23 shows the more detailed output after running a trace with these new provider settings. Note how you can track the request as it flows through the ASP.NET pipeline, including all HttpModules that were invoked. You can also see every Web event that was generated, and the sequence in which it occurred on the stack. If you have a wider screen than this page, you can include other fields in your query as well, such as the timestamp, which will help you spot processing bottlenecks. If a problem occurs, this type of diagnostic output can often help you locate it very quickly. Listing 7-23. A more detailed ETW trace
There's one last thing you should keep in mind. For this example, we're running a trace on a standalone machine where we're the only users. On a production box, these output files can grow large very quickly. For example, when Chris turned on ETW logging on the microsoft.com production Web server in his webcast, he traced using five different providers for one minute. The output file was roughly 120MB in size! So be careful not to start a trace and walk away from the machine, unless you use either logman to schedule a stop time or a maximum logfile size. In case you are wondering, here's a brief explanation of how ETW works under the hood. A system that is instrumented with ETW registers itself as an ETW provider by calling a native Win32 function called RegisterTraceGuids. This function requires that the caller pass in a pointer to a callback function. This is how ETW pings the various providers and tells them to turn on their trace logs or turn them off at runtime. When a provider receives a callback indicating that tracing should be turned on, it will typically flip on a global Boolean variable that turns on all sorts of tracing code deep in its innards. This tracing code calls another Win32 function, TraceEvent, to add records to the trace log. ETW records the time of each trace record and writes the data to a locked memory page in the kernel. The goal here is to ensure that when you turn on tracing, you don't start thrashing the swap file and seriously impact the performance that you may be trying to measure. Behind the scenes, a daemon thread is busy writing out the contents of those kernel memory pages to disk in the form of the ETL trace log. When you run logman to start or stop a trace, under the covers it's using the Win32 functions StartTrace and StopTrace to instruct ETW to signal providers to start or stop tracing. There's really not a lot to ETW, but its ubiquity on the Windows platform makes it very powerful indeed. |
EAN: 2147483647
Pages: 104