Understanding the Plotter Settings
In this section, you'll explore all the settings in the Plot dialog box. These settings give you control over the size and orientation of your image on the paper. They also let you control which part of your drawing gets printed. All these settings work together to give you control over how your drawing will fit on your printed output.
| Warning | If you're a veteran AutoCAD user , be aware that AutoCAD 2005 relies mainly on the Windows system printer configuration instead of its own plotter drivers. It also remembers printers settings that are specific to AutoCAD so you don't have to adjust your printer settings each time you use AutoCAD. This gives you more flexibility and control over your output. Be aware that you'll need to understand the Windows system printer settings, in addition to those offered by AutoCAD. |
Paper Size
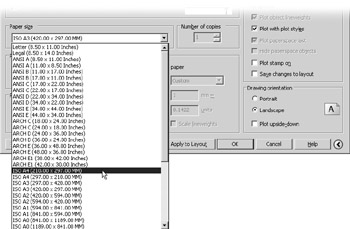
You use the option in this group to select the paper size for your output. You can select a paper size from the Paper Size drop-down list.
These sizes are derived from the sizes available from your currently selected system printer. You'll find out how to select a different printer later in this chapter.
In prior versions of AutoCAD, a radio button was offered to enable you to select from Imperial or metric sheet size options. But because AutoCAD 2005 offers sheet sizes in both Imperial and metric measurements, the radio buttons have been removed. AutoCAD assumes that if you pick a metric sheet size, you will want the sheet dimensions specified in metric measurements and adjusts the dialog box accordingly .
Drawing Orientation
When you used the Preview button in the first exercise in this chapter, you saw your drawing as it would be placed on the paper. In that example, it was placed in a landscape orientation , which places the image on the paper so that the width of the paper is greater than its height. You can rotate the image on the paper 90 ° into what is called a portrait orientation by selecting the Portrait radio button in the Drawing Orientation group. A third option, Plot Upside-Down, lets you change the orientation further by turning the landscape or portrait orientation upside down. These three settings let you print the image in any one of four orientations on the sheet.
In AutoCAD, the preview displays the paper in the orientation that it leaves the printer. So for most small-format printers, if you're printing in the portrait orientation, the image appears in the same orientation as you see it when you are editing the drawing. If you're using the landscape orientation, the preview image is turned sideways . For large-format plotters , the preview might be oriented in the opposite direction. The graphic in the Drawing Orientation group displays a capital A on a sheet showing the orientation of your drawing on the paper output.
| Tip | Remember that you need to click the More Options button in the lower-right corner of the Plot dialog box to access the Drawing Orientation group. The More Options button is the one that looks like a circle with a greater-than sign. |
Plot Area
The What To Plot drop-down list in the Plot Area group lets you specify which part of your draw- ing you want to plot. You might notice some similarities between these settings and the Zoom command options. Each Plot Area option is described next .
Limits
The Limits printing option (available in Model Space only) uses the limits of the drawing to determine what to print (see Figure 7.1). If you let AutoCAD fit the drawing onto the sheet (by selecting the Fit To Paper check box in the Plot Scale group), the plot displays exactly the same image that you would see on the screen had you selected View Zoom All.
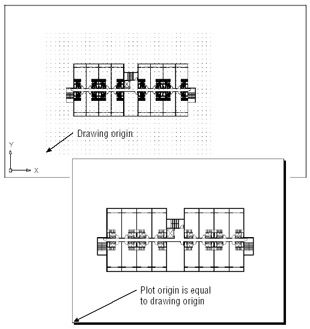
Figure 7.1: The screen display and the printed output when Limits is chosen
Layout
The Layout option (available in Layout tabs only) replaces the Limits option when you plot from a Layout tab (see the section "WYSIWYG Plotting Using Layout Tabs" later in this chapter). This option plots everything displayed within the paper margins shown in the Layout tab view.
Extents
The Extents option draws the entire drawing, eliminating any space that borders the drawing (see Figure 7.2). If you let AutoCAD fit the drawing onto the sheet (that is, you select the Fit To Paper check box in the Plot Scale group), the plot displays exactly the same image that you would see on the screen if you choose View Zoom Extents.
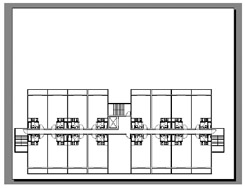
Figure 7.2: The printed output when Extents is chosen
Display
Display is the default option; it tells AutoCAD to plot what is currently displayed on the screen (see the top panel in Figure 7.3). If you let AutoCAD fit the drawing onto the sheet (that is, you select the Fit To Paper check box from the Plot Scale group), the plot is exactly the same as what you see on your screen (see the bottom panel in Figure 7.3).
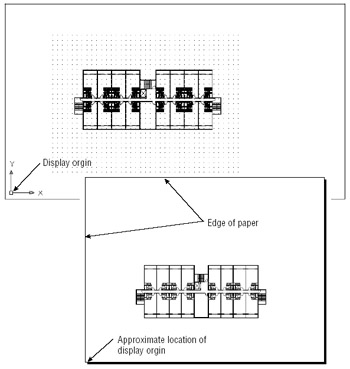
Figure 7.3: The screen display and the printed output when Display is chosen and no scale is used. (The drawing is scaled to fit the sheet.)
View
The View option is available when you have saved a view in the drawing by using the View command. When you select View from the What To Plot drop-down list, another drop-down list appears, offering a list of views available in the drawing. You can then select the view that you want to plot. (Figure 7.4 shows a typical result.)
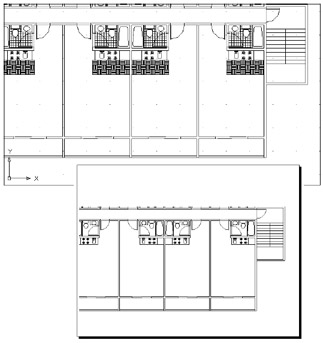
Figure 7.4: A comparison of the saved view and the printed output
If you let AutoCAD fit the drawing onto the sheet (by selecting Fit To Paper from the Plot Scale group), the plot displays exactly the same thing that you would see on the screen if you had recalled the view you are plotting.
Window
The Window option enables you to use a window to indicate the area you want to plot (see Figure 7.5). Nothing outside the window prints. To use this option, click the Window button and then indicate a window in the drawing area. The dialog box temporarily closes to enable you to select points. When you're finished, click OK. If you let AutoCAD fit the drawing onto the sheet by using the Fit To Paper option in the Plot Scale group, the plot displays exactly the same thing that you enclose within the window.
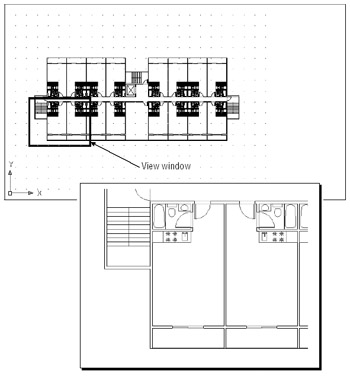
Figure 7.5: A selected window and the resulting printout
| Tip | Do you get a blank printout, even though you selected Extents or Display? Chances are the Fit To Paper check box is not selected, or the Inch = Units setting is inappropriate for the sheet size and scale of your drawing. If you don't care about the scale of the drawing, make sure the Fit To Paper option is selected. Otherwise , make sure the Plot Scale settings are set correctly. The next section describes how to set the scale for your plots. |
Plot Scale
In the previous section, the descriptions of several Plot Area options indicate that the Fit To Paper option can be selected. Bear in mind that when you instead apply a scale factor to your plot, it changes the results of the Plot Area settings, and some problems can arise. This is usually where most new users have difficulty.
For example, the apartment plan drawing fits nicely on the paper when you use Fit To Paper. But if you try to plot the drawing at a scale of 1' = 1 ² , you will probably get a blank piece of paper because, at that scale, hardly any of the drawing fits on your paper. AutoCAD will tell you that it is plotting and then tell you that the plot is finished. You won't have a clue as to why your sheet is blank.
| Tip | Remember that the Plan1.dwg file was set up for an 18 ² 24 ² (A2, or 594 mm 420 mm for metric users) sheet at a scale of 1 / 8 ² = 1'-0 ² (1:10 for metric users). If, when plotting from the Model tab, you select these settings from the Plot dialog box (provided your printer or plotter supports 18 ² 24 ² , or A2, paper) and you also select Limits for your plot area, your drawing will fit on the paper and will be at the appropriate scale. |
If an image is too large to fit on a sheet of paper because of improper scaling, the plot image will be placed on the paper differently, depending on whether the plotter uses the center of the image or the lower-left corner for its origin (see Figure 7.1 earlier in this chapter). Keep this in mind as you specify scale factors in this area of the dialog box.
Scale
You can select a drawing scale from a set of predefined scales in the Scale drop-down list. These options cover the most common scales you'll need to use.
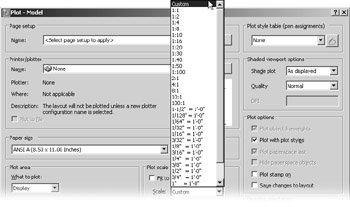
You've already seen how the Fit To Paper option enables you to avoid giving a scale altogether and forces the drawing to fit on the sheet. This works fine if you are plotting illustrations that are not to scale. If you select another option such as 1 / 8 ² = 1'-0 ² , you'll see the inches and units input boxes change to reflect this scale. The Inch = input box changes to 1, and the Units input box changes to 96, the scale factor for a 1 / 8 ² scale drawing.
Custom Scale
If you can't find the scale you want in the Scale drop-down list, you can select Custom from this list and then enter custom values in the Inch = and Units input boxes.
Through these input boxes, you can indicate how the drawing units within your drawing relate to the final plotted distance in inches or millimeters. For example, if your drawing is of a scale factor of 96, follow these steps:
-
Double-click the Inch = input box, enter 1 , and press the Tab key.
-
Double-click the Units input box, enter 96 , and press the Tab key.
Metric users who want to plot to a scale of 1:10 should enter 1 in the MM input box and 10 in the Drawing Units input box.
If you are more used to the Architectural unit style in the Imperial measurement system, you can enter a scale as a fraction. For example, for a 1 / 8 ² scale drawing:
-
Double-click the Inches input box, enter 1 / 8 , and press the Tab key.
-
Double-click the Drawing Units input box, enter 12 , and press the Tab key.
If you specify a different scale from the one you chose while setting up your drawing, AutoCAD will plot your drawing to that scale. You are not restricted in any way as to scale, but entering the correct scale is important: if it is too large, AutoCAD will think your drawing is too large to fit on the sheet, although it will attempt to plot your drawing anyway. See Chapter 3 for a discussion of unit styles and scale factors.
| Tip | If you plot to a scale that is different from the scale you originally intended, objects and text will appear smaller or larger than would be appropriate for your plot. You'll need to edit your text size to match the new scale. You can do so by using the Properties palette. Select the text whose height you want to change, click the Properties tool on the Standard toolbar, and then change the Height setting in the Properties palette. |
Scale Lineweights
AutoCAD offers the option to assign line weights to objects either by their layer assignments or by directly assigning a line weight to individual objects. The line weight option, however, doesn't have any meaning until you specify a scale for your drawing. After you do specify a scale, the Scale Lineweights option is available. Select this check box if you want the line weight assigned to layers and objects to appear correctly in your plots. You'll get a closer look at line weights and plotting later in this chapter.
Shaded Viewport Options
ACAD only Most of your plotting will probably involve 2D technical line drawings, but occasionally you might need to plot a shaded or rendered 3D view. You might need to include such 3D views combined with 2D or 3D Wireframe views. AutoCAD offers the Shaded Viewport Options that enable you to plot shaded or rendered 3D views of your AutoCAD drawing. These options give you control over the quality of your rendered output. (LT users will not have the shaded viewport option.)
| Tip | Remember that you need to click the More Options button in the lower-right corner of the Plot dialog box to get to the Shaded Viewport Options group. The More Options button is the one that looks like a circle with a greater-than sign. |
Shade Plot
The Shade Plot drop-down list lets you control how a Model Space view will be plotted. You can choose from As Displayed, Wireframe, Hidden, or Rendered
As Displayed plots the Model Space view as it appears on your screen.
Hidden plots your Model Space view with hidden lines removed.
Rendered renders your Model Space view before plotting.
The Shade Plot options are not available if you are plotting from a Layout tab. You can control the way each layout viewport is plotted through the viewport's Properties settings. You'll learn more about layout viewport properties later in this chapter.
Quality and DPI
The Quality drop-down list offers options to control the print quality of your shaded or rendered view. Each option determines the dpi (dots per inch) setting for your output:
Draft plots 3D views as wireframe.
Preview offers 150dpi resolution.
Normal offers 300dpi resolution.
Presentation offers 600dpi resolution.
Maximum defers dpi resolution to the current output device's settings.
Custom lets you set a custom dpi setting. When Custom is selected, the DPI input box is made available for your input.
| Tip | If some of the terms discussed for the Shaded Viewport Options are unfamiliar, don't be alarmed. You'll learn about 3D Shaded and Rendered views in Part IV of this book. And when you start to explore 3D modeling in AutoCAD, come back and review the Shaded Viewport Options. |
Plot Offset
Frequently, your first plot of a drawing shows the drawing positioned incorrectly on the paper. You can fine-tune the location of the drawing on the paper by using the Plot Offset settings. To adjust the position of your drawing on the paper, you enter the location of the view origin in relation to the plotter origin in x- and y-coordinates (see Figure 7.6).
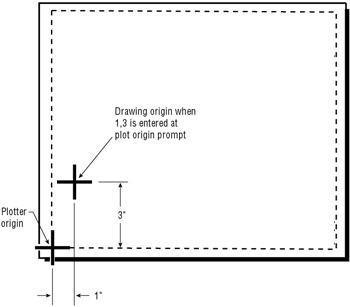
Figure 7.6: Adjusting the image location on a sheet
For example, suppose you plot a drawing, and then realize that it needs to be moved 1 ² to the right and 3 ² up on the sheet. You can replot the drawing by making the following changes:
-
Double-click the X input box, type 1 , and press the Tab key.
-
Double-click the Y input box, type 3 , and press the Tab key.
Now proceed with the rest of the plot configuration. With the preceding settings, when the plot is done, the image is shifted on the paper exactly 1 ² to the right and 3 ² up.
You can also tell AutoCAD the location from which the offset is to occur. The Plot And Publish tab of the Options dialog box (choose Tools Options from the menu bar) offers the Specify Plot Offset Relative To button group. This group offers two radio buttons: Printable Area and Edge Of Paper. You can select the option that makes the most sense for you.
Plot Options
The options in the Plot Options group offer a greater amount of control over your output and require some detailed instruction. Here is a brief description of these options. You'll learn more about them in the next section.
Plot In Background
If you think that your plot will take some time to complete, this option will plot your drawing in the background so that after you begin a plot you can immediately return to your drawing work. This option can also be controlled through the Backgroundplot system variable.
Plot Object Lineweights
As mentioned earlier, AutoCAD lets you assign line weights to objects either through their layer assignment or by directly assigning a line weight to the object itself. If you use this feature in your drawing, this option lets you turn line weights on or off in your output.
Plot with Plot Styles
Plot styles give you a high degree of control over your drawing output. You can control whether your output is in color or black-and-white, and you can control whether filled areas are drawn in a solid color or a pattern. You can even control the way lines are joined at corners. You'll learn more about these options and how they affect your work in the next section.
Plot Paperspace Last
When you are using a Layout tab, otherwise known as Paper Space, this option determines whether objects in Paper Space are drawn before or after objects in Model Space. You'll learn more about Model Space and Paper Space later in this chapter.
Hide Paperspace Objects
This option pertains to 3D models in AutoCAD. When you draw in 3D, you see your drawing as a Wireframe view . In a Wireframe view, your drawing looks like it's transparent even though it is made up of "solid" surfaces. Using hidden line removal, you can view and plot your 3D drawings so that solid surfaces are opaque . To view a 3D drawing in the editor with hidden lines removed, use the Hide command. To plot a 3D drawing with hidden lines removed, use the Hide Objects option.
| Warning | Hide Paperspace Objects does not work for views in the Layout tab viewport described in the next section. Instead, you need to set the viewport's Hideplot property to On. (Click the viewport, right-click, and choose Hideplot On from the shortcut menu.) |
Plot Stamp On
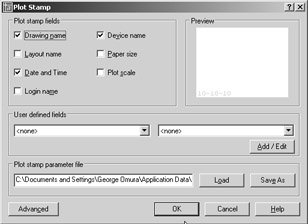
The plot stamp feature lets you place pertinent drawing data on the drawing in a location you choose. This data includes the drawing name , date and time, scale, and other data. When you click the Plot Stamp On check box to turn on this option, an additional button appears.
![]() Click this button to gain access to the Plot Stamp dialog box. This dialog box offers many controls over the plot stamp. This is a fairly extensive tool, so rather than fill this chapter with a description of all its features, see Plot Stamp in Appendix B for a complete rundown of the Plot Stamp options. This option is not available when plotting from the Model tab.
Click this button to gain access to the Plot Stamp dialog box. This dialog box offers many controls over the plot stamp. This is a fairly extensive tool, so rather than fill this chapter with a description of all its features, see Plot Stamp in Appendix B for a complete rundown of the Plot Stamp options. This option is not available when plotting from the Model tab.
Save Changes to Layout
When this option is turned on, the changes you make to Plot dialog box settings are saved with the current layout. You'll learn more about layouts in the next section. This option is not available when plotting from the Model tab.
| Tip | In the Plot dialog box, you'll see the usual OK, Cancel, and Help buttons at the bottom. You'll also see the Apply To Layout button. This button lets you save the plot settings you make without actually sending your drawing to the printer or plotter for output. This option is convenient for those times when you decide halfway through your plot setup not to plot your drawing. |
EAN: 2147483647
Pages: 261