Controlling Color, Lines, and Fills through Plot Styles
When you print your drawing, AutoCAD attempts to reproduce your drawing's appearance in a layout tab or in the Model tab. However, you might want to change the way certain parts of the drawing appear in the printed output. For example, you might want all line work in black instead of the AutoCAD colors, or you might want filled areas in shades of gray instead of solid fills. To produce these effects without actually converting all your objects to the color black, you need to employ plot styles.
You can think of plot styles as a way to translate the colors and fills in an AutoCAD drawing into different colors or patterns. You can control whether the color red on your AutoCAD screen is printed in black or gray or even green, or you can control whether an area filled in solid black is screened to 30 percent. The plot styles also let you specify whether the lines forming the corners of a rectangle are rounded or square, as shown in Figure 12.23.
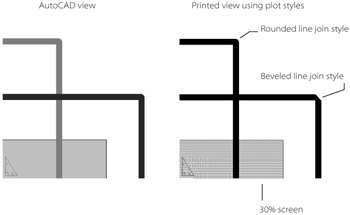
Figure 12.23: Plot styles can translate colors and fills into shades of gray and halftone screens.
You can use two types of plot styles: color and named. Color plot styles let you control printer output based on the color you assigned to the objects in your drawing. For example, you can tell AutoCAD to print the color red as black using a 50 percent screen or as a line width of 0.5mm. This is a method similar to the one used by early versions of AutoCAD, and it persists today, mainly because many old drawings are still in use.
Named plot styles operate in a different way. They let you give a name to a set of printer parameters including the line weight, the color, the percent screen, or the corner condition of line work. You can then apply that named set of parameters, called a plot style, to objects or layers. If you're coming from another CAD program, you might be more familiar with this method of assigning printer parameters to objects in a drawing.
Using AutoCAD's Predefined Plot Styles
AutoCAD comes with a set of plot styles you can use right away. These plot styles are stored in database-like files called plot-style tables. There are actually two sets-one for color plot styles and another for named plot styles. You can select the plot styles from the Plot Style Table drop-down list of the Plot or Page Setup dialog box (see Figure 12.24).
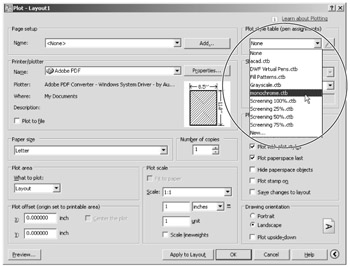
Figure 12.24: Selecting a plot style from the Plot Style Table drop-down list of the Page Setup dialog box
Table 12.2 lists and describes the predefined color plot styles available in AutoCAD. Table 12.3 lists the predefined named plot styles tables.
| PLOT STYLE | PURPOSE |
|---|---|
| | |
| Acad.ctb | Converts the first eight AutoCAD colors to black when printing. |
| DWF Virtual Pens.ctb | Converts AutoCAD colors to virtual pens of the same color in DWF files. |
| Fill Patterns.ctb | Converts the first nine AutoCAD colors into fill patterns. |
| Grayscale.ctb | Converts all AutoCAD colors into grayscale equivalents on printers that support this feature. |
| monochrome.ctb | Converts all AutoCAD colors into black. |
| Screening xxx%.ctb | Converts all AutoCAD colors into a screened value indicated by the Plot Style name (xxx is the screen percentage). |
| New | Starts the Add Color Dependent Plot Style Table Wizard to allow you to create a new plot style. |
| None | No plot styles are applied to the drawing. |
| PLOT STYLE | PURPOSE |
|---|---|
| | |
| Acad.stb | Plots AutoCAD colors as they are displayed in the drawing area. |
| Autodesk-Color.stb | Includes screened "colors" from solid (100 percent) to 10 percent. Uses object color for printed color. |
| Autodesk-MONO.stb | Same as Autodesk-Color.stb but converts colors to black, white, and shades of gray. |
| Monochrome.stb | Converts all AutoCAD colors to black. |
| New | Starts the Add Name Dependent Plot Style Table Wizard to allow you to create a new plot style. |
You might find that you can do most of your work with these standard plot-style tables. At other times, you'll be required by your employer to use custom plot-style tables that have been set up for your projects.
Choosing between Color and Named Plot-Style Tables
If you need to create your own plot-style tables, decide which type of plot-style table you want to use. Named plot styles are more flexible than color plot styles, but if you already have a library of AutoCAD drawings set up for a specific set of plotter settings, color plot styles are a better choice. Color plot styles are the most familiar to users of the older method of assigning AutoCAD colors to plotter pens.
The type of plot-style table assigned to a drawing depends on the template you use to start a new drawing. The acad.dwt template file uses color plot-style tables, and the acad-Named Plot Styles.dwt template file uses named plot styles.
You can also set up AutoCAD to use color or named plot-style tables for the default drawing that appears when you start AutoCAD. The Options dialog box provides controls over the default plot style used for the drawingx.dwg default drawing (x is the drawing number). Here's how to make those settings:
-
Choose Tools è Options to open the Options dialog box, and then click the Plot And Publish tab.
-
Click the Plot Style Table Settings button to open the Plot Style Table Settings dialog box.
-
In the Default Plot Style Behavior For New Drawings button group, click the Use Color Dependent Plot Styles radio button.
-
Click OK, and then click OK again to return to the drawing.
Once you've set up AutoCAD for color plot-style tables, any new drawings you create are allowed to use only color plot-style tables. You can change this setting at any time for new files, but once you save a file, the type of plot style that is current when the file is created is the only type of plot style available to that file. If you find that you need to change a color plot style to a named plot style drawing, see the section "Converting a Drawing from Color Plot Styles to Named Plot Styles" later in this chapter.
Creating a Plot-Style Table
If you're using color plot-style tables, you can create a plot-style table file (with the .ctb filename extension) for different styles of drawings. You might create one for presentation drawings in which certain colors and screened solid fills are assigned to colors in your drawing. Or you might have specific screen settings you use frequently when printing monochrome prints. The following steps describe how you can create your own color plot-style table:
-
Open a drawing, and then click the Layout1 tab.
-
Right-click the Layout1 tab, choose Page Setup Manager to open the Page Setup Manager dialog box, and then click Modify.
-
In the Plot Style Table button group, open the drop-down list, and select New. If the current drawing uses color plot-style tables, you'll see the Add Color-Dependent Plot Style Table Wizard. If it uses a named plot style, you'll see the Add Name-Dependent Plot Style Table Wizard, as shown in Figure 12.25.
-
Click the Start From Scratch radio button, and then click Next.
-
The next screen of the wizard asks for a filename. Enter a name for the file, and click Next.
-
The next screen of the wizard lets you edit your plot style and assign the plot style to your current, new, or old drawings. You'll learn about editing plot styles a bit later.
-
Click Finish to return to the Page Setup dialog box. Once you have created a color plot style, you can make setting changes.
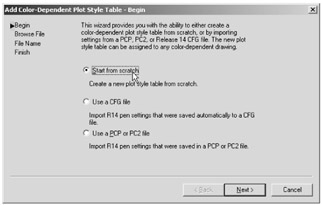
Figure 12.25: The first screen of the Add Name-Dependent Plot Style Table Wizard
Editing and Using Plot Style Tables
Once you've created a plot style, you'll want to set it up the way you want. In the Page Setup dialog box, open the Plot Style Table drop-down list in the upper-right corner of the dialog box, and select the plot style you want to edit (see Figure 12.21 earlier in this chapter). Click the Edit button to open the Plot Style Table Editor dialog box.
![]() The Edit button is just to the right of the Plot Style Table drop-down list. Click the Form View tab, which is shown at the top of Figure 12.26.
The Edit button is just to the right of the Plot Style Table drop-down list. Click the Form View tab, which is shown at the top of Figure 12.26.
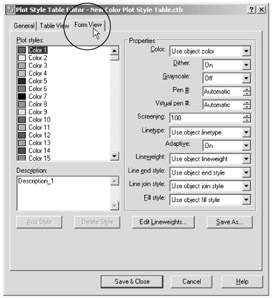
Figure 12.26: The Plot Style Table Editor dialog box, open at the Form View tab
Plot-style table files are located in C:\Documents and Settings\Username\ApplicationData\Autodesk\AutoCAD 2008\R17.1\enu\Plot Styles. To edit a plot-style file, just double-click it.
The Plot Style Table Editor dialog box has three tabs that give you control over how each color in AutoCAD is plotted. The Form View tab lets you select a color from a list box and then set the properties of that color using the options on the right side of the tab.
Understanding the Options in the Plot Style Table Editor
Once you get to the Plot Style Table Editor dialog box, you'll see quite a few options. These options are the same for both the named and color plot-style tables. The main difference is that the color plot-style table lists all 256 of the AutoCAD colors as plot styles. Named plot-style tables list only a single plot style. You can add other plot styles and name them.
The General Tab
The General tab contains information regarding the plot style you're currently editing. You can enter a description of the style in the Description box. This can be useful if you plan to include the plot style with a drawing you're sending to someone else for plotting.
The File Information group gives you the basic information about the file location and name, as well as the number of color styles included in the plot-style table.
The Apply Global Scale Factor to Non-ISO Linetypes check box lets you determine whether ISO linetype scale factors are applied to all linetypes. When this item is checked, the Scale Factor input box becomes active, allowing you to enter a scale factor.
The Table View Tab
The Table View tab offers the same settings as the Form View tab (described next), only in a different format (see Figure 12.27). Each plot style appears as a column with the properties of each plot style listed along the left side of the tab. To change a property, click the property in the column.
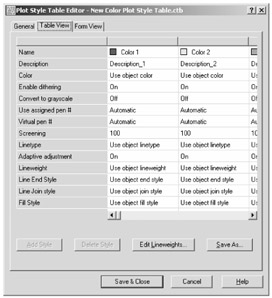
Figure 12.27: The Table View tab of the Plot Style Table Editor dialog box
To apply the same setting to all plot styles at once, right-click a setting you want to use from a single plot style, and choose Copy from the shortcut menu. Right-click the setting again, and then choose Apply To All Styles from the shortcut menu.
The Form View Tab
To modify the properties of a plot style or color, select it from the list at the left side of the Form View tab, and then edit the values in the Properties button group on the right side of the dialog box (see the Form View tab in Figure 12.26 earlier in this chapter). For example, to change the screen value of the Color 3 style in a color plot-style table, highlight Color 3 in the Plot Styles list, double-click the Screening input box, and enter a new value.
You can select several plot styles at once from the list by selecting the first plot style and then Shift+clicking the last one in a group. Or you can Ctrl+click individual plot styles.
The following describes the settings in the Form View tab:
-
Description This option allows you to enter a description for each individual color.
-
Color This option allows you to select a print color that is different from the display color.
-
Dither Dithering enables your plotter to simulate colors beyond the basic 256 available in AutoCAD. Although this option is desirable when you want to create a wider range of colors in your plots, it can also create some distortions, including fine, broken lines, and false colors. For this reason, dithering is usually turned off. This option is not available in all plotters.
-
Grayscale This option converts colors to grayscale.
-
Pen # This option lets you specify what pen number is assigned to each color in your drawing. This option applies only to pen plotters.
-
Virtual Pen # Many ink-jet and laser plotters offer "virtual pens" to simulate the processes of the old-style pen plotters. Frequently, such plotters offer as many as 255 virtual pens, with each pen offering a different line weight or pattern. Plotters with virtual pens often let you assign AutoCAD colors to a virtual pen number. This is significant if the virtual pens of your plotter can be assigned screening width, end style, and joint styles. You can then use the Virtual Pen settings instead of the settings in the Plot Style Table Editor dialog box. This option is most beneficial to users who already have a library of drawings that are set up for plotters with virtual pen settings.
-
You can set up your ink-jet printer for virtual pens under the Vector Graphics listing of the Device And Documents Setting tab of the Plotter Configuration Editor dialog box.
-
Screening Lets you set the screening value for a color. A screening value of 50 will print a color that is half, or 50 percent, of its value. For example, black with a screening value of 50 will print as gray. Black with a screening value of 20 will be a lighter gray than if set to a 50 percent value.
-
Linetype If you prefer, you can use this setting to control linetypes in AutoCAD based on the color of the object. By default, this option is set to Use Object Linetype. I recommend you leave this option at its default.
-
Adaptive This option is on by default. The Adaptive option controls how noncontinuous linetypes begin and end. Noncontinuous lines have gaps so this option forces linetypes to begin and end in a line segment. With this option turned off, a noncontinuous linetype is drawn without regard for its ending. This can cause the line to appear as though its end is missing because it can end on the gap portion of the noncontinuous line.
-
Lineweight This option lets you specify the thickness of lines. You can select a line weight from a drop-down list. If you need to modify a line weight, you can do so using the Edit Lineweights button near the bottom of the Plot Style Table Editor dialog box.
-
Line End Style This option lets you specify the shape of the ends of simple lines that have a line weight greater than zero.
-
Line Join Style This option lets you determine the shape of the corners of polylines (see Figure 12.28).
-
Fill Style This option lets you set up a color to be drawn as a pattern when used in a solid-filled area. The patterns appear in the drop-down list, as shown in Figure 12.29.
-
Add Style Clicking this button lets you add more plot styles or colors.
-
Delete Style Clicking this button deletes the selected style.
-
Edit Lineweights When you click this option, the Edit Lineweights dialog box appears. This dialog box lets you change the line weights offered in the Lineweight option. This dialog box also lets you specify whether to show line weights in inches or millimeters.
-
Save As Clicking this button lets you save the current plot-style table.
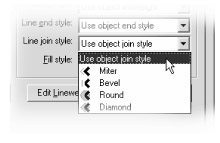
Figure 12.28: The Line Joint Style options
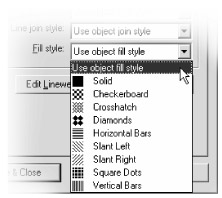
Figure 12.29: The Fill Style options