Section 10.2. Debugging the Application
10.2. Debugging the ApplicationGWT doesn't have a built-in debugger. Why force you to learn yet another tool? Instead, Google provides hooks that can be used by most Java IDEs, so you can use your IDE's debugger.
This chapter demonstrates the Eclipse IDE, which seems to be the unofficial de facto reference IDE of GWT. To create an Eclipse project for GWT:
Now start up Eclipse and import the project. That is done from the Eclipse File menu (File Figure 10-5. Eclipse with the ZipCodes GWT project loaded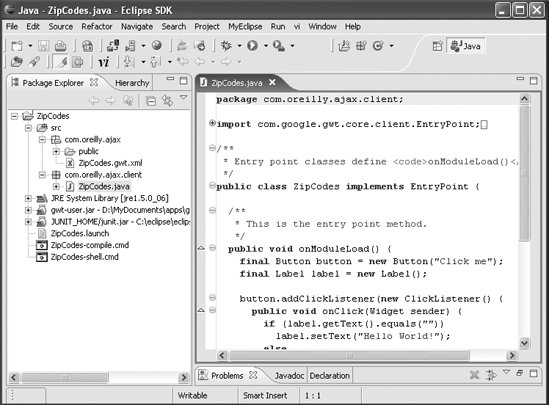 Now start the project in hosted mode with debug capability (Run Figure 10-6. The Eclipse debug configuration window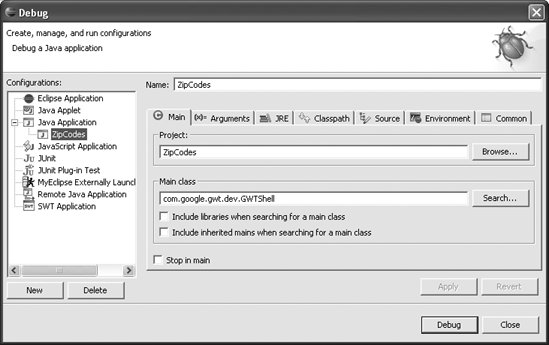 Select the ZipCodes application in the lefthand pane. The window will update to reflect the ZipCodes project information. Notice that the main class is com.google.gwt.dev.GWTShell. That class starts the Tomcat server. It is important to make sure that both the source code and the compiled code are in the classpath. The source needs to be listed first, because in hosted mode the client Java class source is used to debug the client-side code. The debugger is actually looking for Java classes (host mode), not JavaScript (web mode), so it must find the Java source for the client in the classpath first. Click the Debug button to start the GWT application in host mode. Two windows will appear on the desktop (Figure 10-7). First, you'll see the Google Web Toolkit Shell. This is actually a custom Tomcat application server running on port 8888. GWT then starts the application itself and launches a browser window to show the client view. Figure 10-7. The GWT shell and browser started through Eclipse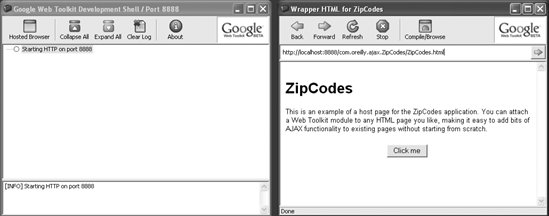 Now that the debugging environment has been configured, you can get to work. Let's start by introducing a breakpoint. First, open the ZipCodes.java file by clicking on that file in the left pane (refer back to Figure 10-5). Then move the cursor to the line of code in onModuleLoad( ) where the button label is set to "Hello World" (see Figure 10-8). Figure 10-8. Setting an Eclipse breakpoint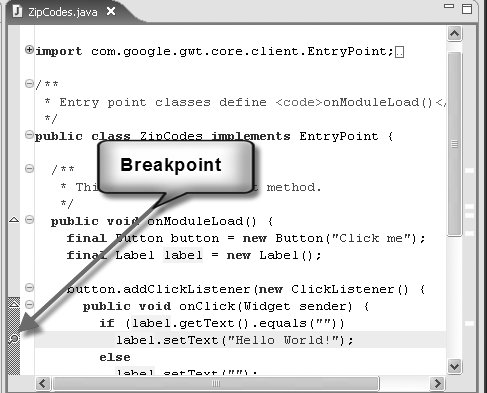 Double-click in the left margin of the code window, next to the line where you want the breakpoint. Now, go back to the browser window and click the "Click me" button. The code will begin executing and stop at the breakpoint that you just set. Then Eclipse will transfer control of the application to the debugger. Now change the "Hello World" text to something else, like "Goodbye cruel World!": label.setText("Goodbye cruel World!"); Press Ctrl-S to save the file, then press F8 three times to start the execution of the file. You have to press it three times because when you change code that is being debugged, the debugger starts at the entry point to the method that was changed. The first time you press F8, Eclipse takes you back to the start of the method. The second F8 takes you to the breakpoint again, and the third F8 moves the program past the breakpoint. Figure 10-9 shows the result. Figure 10-9. The result of changing the label text during debugging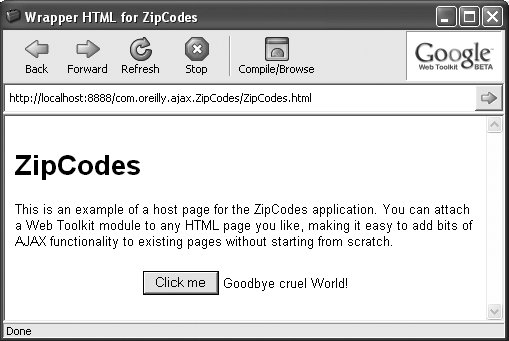 This is really a breakthrough! You've started debugging a GWT application. Now you can have very productive development cycles with Ajax, thanks to complete round-trip debugging provided by the Google Web Toolkit. |

 Import
  "Existing Projects into Workspace). Browse to the directory where you created the ZipCodes project, and then make sure the checkbox next to ZipCodes is checked. Figure 10-5 shows what you should see in Eclipse when you reach this point.
- Step 1.1 Install OpenSSH to Replace the Remote Access Protocols with Encrypted Versions
- Step 3.1 Use PuTTY as a Graphical Replacement for telnet and rlogin
- Step 4.7 Using Public Key Authentication for Automated File Transfers
- Step 6.2 Using Port Forwarding Within PuTTY to Read Your E-mail Securely
- Step 6.3 X11 Forwarding