HP ProLiant Essentials Performance Management Pack
| < Day Day Up > |
| PMP is a software solution that detects and analyzes hardware bottlenecks on ProLiant servers. PMP provides the tools to deliver proactive notification of building bottleneck conditions and to recognize existing performance issues. PMP was first available in HP Insight Manager 7 sp2; PMP v3.0 is available in HP Systems Insight Manager v4.1. PMP monitors and automatically analyzes performance of five server subsystems:
PMP analyzes the performance information to determine whether there is an impending or existing performance bottleneck issue. You can interactively display this information, log the information to a database for later analysis or reporting, and set up proactive pager or e-mail notification using the HP Systems Insight Manager Notification mechanism. The online analysis tool for PMP is an intelligent , easy-to-use tool and monitors servers running Windows NT 4.0, Windows 2000, and Windows Server 2003 (see Figure 8.1). You access this Web-based application through a browser, which enables you to watch and analyze in real time the performance of any monitored server from a separate client. Tools for offline analysis are also provided. Figure 8.1. PMP online analysis tool.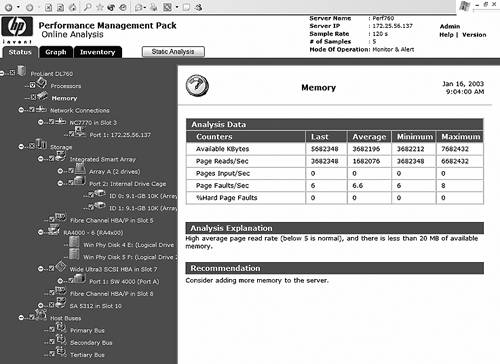 Typical Uses for PMPYou can use the PMP tool in a number of ways. For instance, an IT department can use it to analyze performance before users report service-level problems. This would enable the department to become aware of performance problems anywhere in the data center before they become an issue, and enable them to quickly diagnose and address the problems. Using PMP, the IT department would be able to perform a server configuration analysis to find potential performance problems due to configuration errors. Thanks to the tool's proactive notification, administrators are notified as a problem builds. Then, using PMP's interactive analysis tool, administrators can quickly drill down to understand the problem. You also can use PMP to solve after-hours performance problems. For instance, say sporadic performance issues are popping up at odd hours at your company. The IT department cannot afford 24 x 7 staff members to catch the problems when they occur. This presents some specific problems where you need to capture the proper performance information at the time of issue and need to analyze the performance data after the fact. PMP provides a solution through data logging, which allows the user to catch performance issues on one or more servers whenever they happen and playback allows interactive analysis as if the user where there at the time it happened . PMP can also help extend the useful life of a server. In many companies, IT departments have been told to keep servers longer than they normally would. Service levels must be maintained and head count must stay flat presenting the need to identify server performance to avoid service-level issues otherwise avoided by server replacement, along with the need to acquire performance analysis expertise. PMP identifies the server components that are causing performance problems, allowing precise corrections, and explains the problems at a "lay" level requiring no additional expertise. PMP can also provide a solution for IT department with servers that are working, but are very old. Users are not complaining about specific problems, but are starting to grumble about performance. The IT manager needs justification for replacement, such as performance information showing servers approaching a problem state and reports proving this. PMP provides data logging that captures all statistics for all servers and reporting that summarizes and extracts all statistics into a reporting tool to generate specific reports. As servers are replaced with more powerful systems, typically an IT department wants to decrease the number of servers in the data center by consolidating workloads from several servers onto a single server. To plan for the consolidation, you need to determine what the load upon the current servers is to select consolidation candidates to make sure that the consolidation doesn't overload the systems. PMP can assist in the process with its monitoring, logging, and reporting features that enable detailed analysis of candidate systems and then monitor the systems in real time after consolidation to pinpoint any incompatible workloads. PMP ArchitectureThe PMP service is designed to run on a middle- tier server (analysis server), which also serves as the System Insight Manager Console server and performs the bulk of the processing. Monitored servers are only required to run the standard Insight Management Agents. PMP gathers monitored information from the Management Agents by means of Simple Network Management Protocol (SNMP) in much the same way Insight Manager does. Because of the design of PMP, there is minimal impact on the monitored servers. Performance and functionality data are accessed from a client machine by means of a Web browser in which an applet runs to display the information. PMP uses Microsoft Structured Query Language (SQL) 7, Microsoft SQL 2000, or Microsoft Database Engine (MSDE) as the database software for storing and cataloging the collected data for the middle tier (analysis server), as shown in Figure 8.2. Figure 8.2. PMP architecture diagram. PMP and Insight Manager Console IntegrationAs noted earlier, the performance monitoring service is designed to run on a middle-tier server, which also serves as the SIM or Insight Manager 7 server. This service calculates performance status, updates information available for display from the Insight Manager home page, generates alerts to Insight Manager, supplies information to any online analysis sessions, and logs information to the PMP database. PMP uses the PF column (shown circled in Figure 8.3) to identify server performance. The status of the monitored servers and their components is depicted using color -coded icons. Clicking the icon launches the online analysis Web interface shown previously in Figure 8.1. Figure 8.3. The Insight Manager 7 PF column displays PMP monitored servers.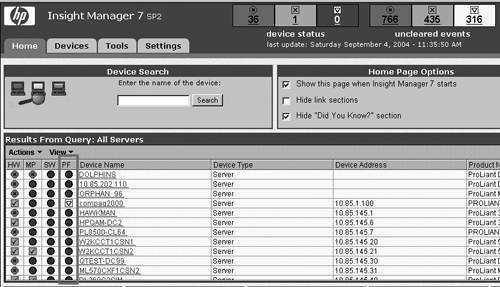 Sizing the Server Workload DependenciesThe PMP workload depends on several factors:
PMP collects all the hardware information from the monitored servers using SNMP. Therefore, the PMP server workload and the network load increase in direct proportion to the number of servers that PMP monitors. The workload also increases in proportion to the amount of hardware (such as network ports, RAID arrays, Peripheral Component Interconnect [PCI] busses , drive controllers, and memory modules) configured on each monitored server. Agent sampling interval determines how often PMP collects performance data from the monitored servers. The interval between samples can vary from 5 seconds to 60 minutes and is set independently for each monitored server. The more frequently PMP takes samples of each monitored server (that is, the shorter the sampling interval), the higher the workload for the PMP server. PMP provides three different functions: monitoring, alerting, and logging. Each of these functions creates different levels of activity that affect performance. PMP can perform different activities on each monitored server. For example, PMP can monitor performance bottlenecks on one server, but monitor and log performance information to the database for another server. PMP is active for a particular server only if monitoring is enabled. When monitoring is enabled, the PMP software gathers data from the monitored server and analyzes it. Using the analyzed data, PMP updates the performance information column on the Systems Insight Manager browser page. Users can also view and interpret the data through the online analysis tool. PMP can alert the user if a performance bottleneck occurs. If performance of a monitored server changes, the PMP service sends HTTP calls to the Systems Insight Manager service to create a Systems Insight Manager event. This is normally the only additional activity on the PMP server when alerting is enabled. The user can define an event handler for the PMP events within Insight Manager 7, which would create more activity upon an alert. PMP can log the performance data collected from a server. At each sampling interval, PMP writes the performance and configuration information for the monitored server to the database. Thus, logging can add significant activity to the PMP server. Capacity PlanningUsing PMP to monitor systems creates a load on the PMP server. The number of systems that can be monitored by a PMP server depends on the resources and functions that are being monitored on each server. To help plan for the processing and storage capacity needed for a PMP server, consider the following guidelines, which were generated by HP lab testing for capacity planning:
note For more information on sizing and configuration for the ProLiant Essentials PMP to help plan server capacity, see http://h18004.www1.hp.com/products/servers/proliantessentials/valuepack/PMP/documentation.html . Client RequirementsPMP requires that Internet Explorer (IE) 5.5 with SP2 or later be installed on any client system. note To determine the current version of IE, open the browser, and select Help, About Internet Explorer from the menu bar. An information box listing the current version appears. v5.50.4807.2300 or later is required. Additionally, you must have the following browser security options enabled on the Local Intranet Web content zone for PMP to function properly:
Installing PMPPMP is installed by default when you install SIM or Insight Manager 7 SP2. PMP is on the Management CD. SIM with PMP 3.0 is scheduled for SmartStart 7.10. Insight Manager 7 with PMP 2.x is available on SmartStart 6.4 and 7.0. Alternatively, both products and their updates are available for download from the HP Web site. note PMP 2.x will remain available and continue to be supported for HP Insight Manager 7 SP2 environments for one full year after the PMP 3.0 launch in May of 2004. For more information on installing SIM or Insight Manager 7 from the Management CD, refer to the documentation available on the Management CD. After inserting the CD, wait for the autorun program to execute, and then select the Documentation tab on the menu. note To manually access the autorun menu, run [CD-ROM drive:]\Autorun\Autorun.exe from the Management CD. PMP VersionsPMP v2.x is available for Insight Manager 7 SP2.x, and PMP v3.0 is available for SIM 4.1 or later. HP ProLiant Essentials PMP 3.0 builds on the foundation of PMP 2.0. The most obvious differences are the integration with HP SIM and the support for MSA500 and MSA1000 shared storage devices. Another change includes improvements in usability through full use of the HP SIM menu bar to access PMP tools. Existing investments in PMP 2.x are protected because PMP 2.x and PMP 3.0 share the same part numbers and license keys. A license for PMP 2.x is a license for PMP 3.0 and vice versa. PMP 2.x will remain available and continue to be supported for HP Insight Manager 7 SP2 environments for a year after the PMP 3.0 launch. Automatic LicensesThe PMP 3.0 console server itself is automatically licensed for free. Also, any ProLiant server in the following series is automatically licensed for free in PMP 3.0: ProLiant 5500, 6400R, 6500, 7000, 8000, and 8500, provided they are equipped with Pentium III Xeon processors, are running a supported version of a Windows OS, and have the correct Insight Management agent. note PMP is a licensed product that requires a license for each server that will be monitored. Currently, a single license is included with the product and the initial release of PMP 3.0 will include five free licenses. |
| < Day Day Up > |
EAN: N/A
Pages: 214