Building a Business Plan: Cost Savings and Return on Investment
| < Day Day Up > |
| I often hear Administrators complain about management's shortsightedness in not making improvements, when the technical team fails to adequately make its case. You have to build a "business case" and show management how the company's investment will result in cost savings, in improved productivity or manufacturing capacity, or in other benefits in the long run. This section of the chapter is designed to give technical System Administrators the information and tools they need to address issues such as determining the Return on Investment (ROI), calculating payback periods, and collecting and analyzing data to justify expenses. Although you won't be a financial analyst after reading this section, you will have a practical understanding of what ROI and TCO mean and how to use them in planning and justifying the migration to upper management. tip Solution Matrix provides a wealth of free information regarding how to build a business case in the form of whitepapers and even a spreadsheet for calculating ROI at http://www.solutionmatrix.com. I highly recommend this site and I quote several things from its papers in this section of the chapter. Explaining ROI and TCOYou can measure whether actions will be or have been successful in many ways; ROI and TCO are only two such methods . A complete treatment of the many ways to determine the success of a migration is beyond the scope of this book. However, Solution Matrix provides a number of whitepapers at http://www.solutionmatrix.com that give a pretty good, quick education. ROISimply stated, ROI is the financial gain expected or realized from an investment of resources. The formula, as one whitepaper stated is
For example, if we want $30,000 (cost) to fund a five-year project, and the project yields $55,000 in revenue (gain), the ROI would be:
Obviously, the higher the ROI, the better. For ROI to be a valid measuring stick, you must have well-defined costs, and the project should result in well-defined benefits, neither of which is easy to do. However, by identifying specific areas in which a migration can benefit your organization, you can use ROI as a simple, effective tool to justify the migration. This means using accurate methods to identify costs and benefits is essential to a believable and defendable ROI. Remember, if you make a claim that a project such as migration will result in cost savings, you need to be able to prove it. I will treat this in more depth later in the "Hard Cost Savings" section of this chapter. Closely associated with ROI is the payback period , which is the amount of time, realizing the gain from implementing the project, that it will take to pay back the investment. In the example I just described, the gain was $55,000 over five years. If that is a linear rate, or $11,000 per year, it will take about two years and nine months to recover the investment of $30,000. note The Solution Matrix Web site (http://www.solutionmatrix.com) offers a free download of a spreadsheet that aids in calculating ROI. TCOTCO is a set of processes, following best practice recommendations, that assesses the impact of a project (such as a migration) and determines the cost to the entire organization of money and other resources. A good example of TCO is an article I read about adopting a Linux desktop for all users. Although this might finally let you snub Microsoft and save money in the process, you need to look at it from a TCO perspective. That is, consider the overall impact of doing this. Ask questions such as
I'm not trying to advocate adopting or not adopting the Linux desktop. I'm merely pointing out that you must look at the total cost of ownership before making such decisions. In this case, you must analyze how this change will impact the environment and make cost estimates on the points I noted here, as well as others you will likely identify. That's the whole idea of TCO ”to get a holistic view of the environment and determine the total cost. Another example is saving money by buying untested software, buying bargain basement hardware, or hiring inexperienced staff. Yes, it is cheaper in the short term because there is a low outlay of cash. But when you have client downtime due to software bugs or failures, hardware outages, or IT staff members that make decisions that cause outages and incur additional support costs, those savings can be wiped out in a hurry. During the early days of Windows 2000, one report identified the following factors (in this order) that contribute to the savings in TCO:
Note that the most significant factor affecting TCO is downtime, with hardware/software bringing up the rear. The next sections cover how to identify areas of cost savings. Reduction of downtime ”and proving that reduction ”is, in my experience, the single biggest factor in justifying any project. Look for more on that in the "Hard Cost Savings" section later in this chapter. ToolsA number of tools are available to calculate ROI, payback, and other financial measurements. Because printed media can't keep up with the changes on the Web, you should search for keywords such as ROI + Windows (or Microsoft). I found two pretty good tools in my search: one from Solution Matrix quoted previously in this section and one from Microsoft. Each tool gives you the framework with the underlying equations and you supply the accurate data. The Solution Matrix ROI tool is available from its Web site at http://www.solutionmatrix.com. Solution Matrix has a liberal copyright policy that allows you to give away (but not sell) the spreadsheet, so it is included on this book's Web site at www.phptr.com/title/0131467581, in case Solution Matrix's Web site or the spreadsheet isn't available when you read this. There is no charge for downloading the spreadsheet. This tool includes a worksheet to calculate ROI, as shown in Figure 3.1. Note that it shows cumulative cash flow over several years as well as the ROI after Year 1, 2, and 3. This tool helps even the novice perform ROI calculations. In addition, this tool also includes worksheets for calculating payback, Net Present Value (NPV), Internal Rate of Return (IRR), Cumulative Cash Flow, and Cash Flow (the latter of which is shown in Figure 3.2). Note that the Cash Flow worksheet produces a scenario of what would happen if the project were implemented, and what would happen if it weren't. This is a good way to demonstrate benefits ”by comparison with the status quo. Figure 3.1. Solution Matrix's ROI worksheet is part of the FinancialMetrics95.xls spreadsheet offered on its Web site. (Printed with permission.)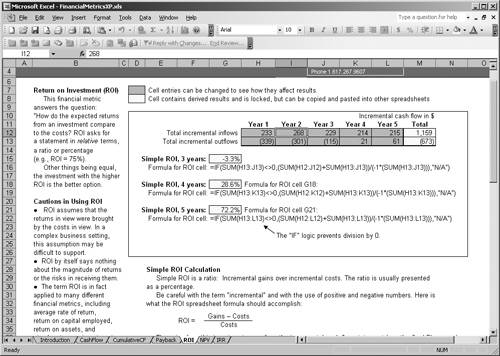 Figure 3.2. Solution Matrix's Cash Flow worksheet. (Printed with permission.)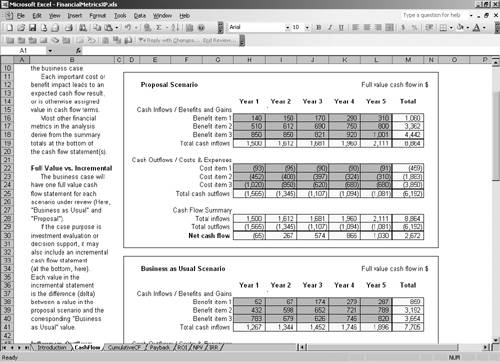 note If you are unfamiliar with the terms Net Present Value, Internal Rate of Return, Cumulative Cash Flow, and other terms used in this section, they are defined on Solution Matrix's Web site for your convenience. Solution Matrix provides whitepapers and other information to help you understand how to use these tools. Microsoft also offers an ROI calculation tool, although it is less sophisticated than the Solution Matrix tool. Microsoft hosts a Web site for creating business cases at http://www.microsoft.com/uk/windowsserversystem/exchange/product-information/the-business-case.mspx. Microsoft also offers the ROI Financial Modeling Tool and the Exchange 2003 Evaluation Supplement. The ROI tool helps you calculate ROI, TCO, and payback period of an Exchange 2003 deployment, although you can easily adapt it for a migration or other project. This tool is " . . . designed to be used with the associated Nucleus Research report . . . " according to the introduction on the main page. The tool uses a step-by-step approach, as you can see in Figure 3.3, whereby you enter costs and benefits, calculate and view the results, and generate a report. Optionally, you can use the Three Minute Quick Calc" shown in Figure 3.4, whereby you can enter all of this data on a single page ”presumably for a small project, such as calculating ROI on a server purchase. Figure 3.3. Microsoft's ROI Financial Modeling tool uses a step-by-step approach.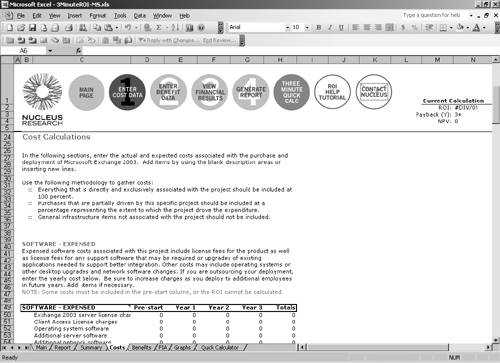 Figure 3.4. Microsoft's ROI Financial Modeling tool features a simple Three Minute Quick Calc form. note The examples shown in Figures 3.3 and 3.4 are intended to give you an idea of what the tool looks like, not to disseminate any specific information. Download the tool for more information. Although you might find these tools helpful when you create your business case, they are useless without data. In the next sections, I discuss how to identify cost savings that you can use to calculate ROI, TCO, and other financial justification methods for a Windows 2003 migration. Hard Cost SavingsOne trap that many ROI calculations fall into is in trying to predict the cost savings to be realized by implementation of a project, in this case, migration to a newer version of the operating system (OS). The classic case was a conference I attended several years ago at which the speaker was trying to explain how to cost-justify a migration to Windows 2000 based on the Windows 2000 benefit of power management. He stated that improved power management could save each employee an hour a day in productivity. He took one hour, multiplied by the number of employees , multiplied by the number of working days in the year, and arrived at a savings of over $2 million just by using Windows 2000 power management. The fallacy, of course, is that even if it did save an hour a day, you could never prove it. If management accepted the argument and gave you the money for the upgrade, then in a year asked you to prove you saved $2 million, how would you do it? Hard cost savings are savings that 1) you are reasonably certain will occur based on past history and expected benefit from the migration and 2) are easily proven. For instance, going back to the Gartner TCO findings, the most significant areas for savings are reducing downtime, support costs, hardware/software costs, and so on. If Windows Server 2003 has a feature that will reduce downtime by 10 hours a month, based on past performance, you can easily calculate that savings (# employees * # hrs * labor rate). By keeping records and using logs, you can prove how many hours of downtime you had after the upgrade compared to before. This is much easier than calculating savings on power management. Calculating hard cost savings for an upgrade from Windows NT to Windows Server 2003 is easy. Doing the same for a migration from Windows 2000 might not be as easy, depending on your environment. Table 3.1 shows some advantages that Windows Server 2003 has over Windows 2000 and Windows NT that could result in hard cost savings. Table 3.1. Examples of Hard Cost Savings When Migrating to Windows 2003
Obviously this isn't a complete list, but it gives you an idea. Perhaps after reading Chapter 1, "What's New in Windows Server 2003 and in ProLiant Architecture and Tools," you have identified Windows Server 2003 features that would solve a particular problem or give your enterprise measurable savings. For instance, if it takes you a long time to rebuild a GC, the IFM feature would be significant to you. When Compaq migrated from Windows NT to Windows 2000, it collapsed nearly 2,000 domains to 4, and realized a huge savings in server reduction. This allowed Compaq to reallocate hundreds of servers previously used as domain controllers (DCs). Compaq quantified savings in several areas:
Multiply these savings by the hundreds of reallocated servers and it really adds up. In addition, consider that fewer servers lower the probability of failure. Reducing the number of servers by say 50% also reduces the probability of failure. Replacing the remaining servers with new hardware also reduces the probability of failure, which reduces the probability of downtime, resulting in further cost benefit. As noted in Chapter 1, HP identified huge potential savings via the IFM feature that allowed them to restore a GC (used by Exchange) in 20 minutes compared to 3 to 5 days in Windows 2000. Considering the lost time when Exchange is down or the poor performance when users are sent to a remote GC, the labor savings from downtime is significant. By contrast, when Compaq upgraded from Windows NT to Windows 2000, the savings was mainly in hardware, reducing the number of DCs by more than 1,000 machines, along with associated administration, maintenance, software licensing, and support costs. Remote Desktop is another feature that can be used to identify cost savings. It didn't exist in Windows NT, and was a Windows component called Terminal Services (Administrative Mode) in Windows 2000. In Windows XP and Windows Server 2003, Remote Desktop is built in and available without any installation, and allows features such as the use of local resources ( drives , ports, audio, printer, and so on) from the remote machine. Many companies rely on this feature for remote administration of machines in Windows 2000. With the new features noted as well as the Remote Desktop on the XP client, it provides fertile territory for calculating cost savings because you can minimize on-site IT staff. I provide more details on Remote Desktop in Chapter 14, "Remote Access Service." The secrets to identifying hard cost savings are to
You might not need a lot of different savings areas if one or two (like HP found) is significant enough to prove your business case. note You can find an in-depth analysis of many of these cost-savings areas in Gary Olsen's book, Windows 2000: Active Directory Design and Deployment (New Riders, 2000). Incidental Cost SavingsBesides the hard cost savings I just identified, you need to determine other incidental or "soft" cost savings. These are savings that can be difficult to prove, but might help influence the decision on the viability of the migration. It is likely impossible to provide actual data to prove that cost savings result from features such as client-side caching, improved data recovery, hardware support, or improved tools such as Group Policy Management Console (GPMC) that help Administrators be more productive. Microsoft's testing shows that Windows Server 2003 is two times faster on average as a file server, three times faster as a dynamic Web content server, and four times faster as a static Web content server when compared to Windows NT 4.0. Although it would be difficult to get actual cost savings experienced by your users to prove these figures, providing faster access to files and Web content certainly makes employees more productive. Present these items as part of the business case as added features, and provide detail or specific examples of incidents where these features would have helped in administration time, problem resolution, and so on. tip Use the new features that we noted in Chapter 1 to classify areas in which you can easily identify cost savings for your enterprise. Perhaps make a spreadsheet listing the features, and identify which could result in hard savings and which would be incidental savings. The ProLiant AdvantageObviously, this book is weighted to those deploying Windows Server 2003 on ProLiant hardware. It is important to remember that Microsoft has developed Windows 2000 and Windows Server 2003 on ProLiant hardware for the past six years, so that gives ProLiant servers a leg up on the competition because that provides confidence in the capability of ProLiant servers to support the OS. Chapters 1 and 2 already detailed ProLiant's tools and usability, and Chapters 7 and 8 detail installation and provisioning methods, while Chapter 9, "ProLiant Essentials Rapid Deployment Pack (RPD)," provides a detailed look at the Rapid Deployment Pack (RDP). These tools can be used to effectively reduce the time it takes to deploy or redeploy servers. For example, the RDP tool enables you to create images of servers, including DCs, and then deploy them. The images are tracked in a Structured Query Language (SQL) database and can be recalled for later use. For instance, one customer I worked with deployed a large number of different ProLiant server models and configurations over a period of years. These servers were used for various applications, such as DCs, Exchange servers, file and print servers, and so on. Using RDP to build and deploy the images from which those servers were built, they were able to catalog all the images they had used as well as the server each image was used to build. Thus, if an Exchange server in Chicago crashed, they knew which image was used, and a new server could be built immediately from that image. Other tools in the ProLiant product line that can provide cost savings include
|
| < Day Day Up > |
EAN: N/A
Pages: 214