Network and Protocol Analyzers
| The first level of network testing consists of making sure that the underlying physical cabling structure is performing as expected. The next level is to monitor and test the network traffic and messages generated by the network protocols to be sure that you have a healthy network. Network analyzer products operate by monitoring the network at the Data Link and Transport layers in the OSI reference model.
Again, you will find that the tools you can select for protocol analyzers range from the very inexpensive (free) to the very expensive (several thousand dollars). One difference between these kinds of tools and those used to check cables, however, is that you need to have a good understanding of the network structure and protocols used before you can make meaningful judgments about the data you collect. The LAN analyzer allows you to intercept network traffic as it passes through the wire in real-time and save the data for analysis. A good analyzer should be able to produce meaningful statistics about the traffic on the network, decode the protocols that are used, and provide a good filtering capability so that you don't get bogged down in an overwhelming amount of data. You should consider many factors when deciding on a network analyzer product. The most basic factor is whether you want a portable device that can be transported to different sites or one or more devices that can be placed at strategic locations in the network to perform continuous monitoring. Other features to consider include the following:
A good LAN analyzer allows you to monitor network traffic in real-time mode, using filters to narrow the scope of your view. You can set up capture filters, store part or all of the frames that match in a buffer, and perform further analysis. Establishing a BaselineBefore you begin to perform monitoring or analysis of the network usage and utilization, you need to establish a set of baseline data. To interpret the statistical data that you can collect using LAN analyzers, you need to have something with which to compare future measurements. Baseline data is used to define the normal operating environment for a system and provides a reference for monitoring and troubleshooting efforts. Baseline data is useful not only for troubleshooting, but also for planning capacity and measuring the effectiveness of an upgrade. Things you should consider recording in your baseline documentation in addition to values you monitor with a LAN analyzer include such things as these:
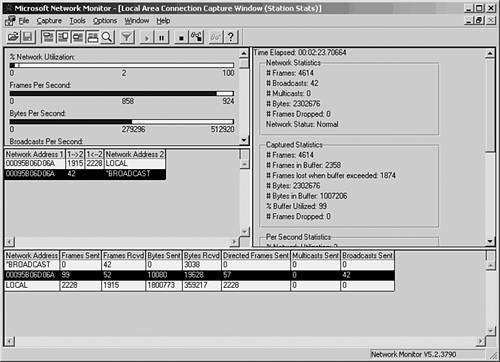
Knowing the type of equipment is important because different models of NICs, hubs, and other devices can vary widely in their performance. Knowing where each piece of equipment is located can enable you to create an audit trail for troubleshooting. For example, it is common in a business environment for users and workstations to be constantly on the move. A simple weekend move, in which you take a few workstations or servers and move them to a different location, might have a dramatic, unexpected impact on the network. Suppose you have two servers that you want to move from a departmental location to a central computer room. When they were located on the same network segment as the users that use them the most, traffic was localized. Placing them on a different segment might cause capacity problems in a backbone link or in a device such as a switch or router that connects the network. If you keep track of hardware and statistical information about its performance and usage, you can usually prevent this sort of thing from happening. At least, you can look back and determine where a problem lies and be in a better position to find a solution. This same principle applies to the location of users in the network. Different users can make widely differing demands on a single workstation or server. Keep a list of users, the applications they use, and, when appropriate, the time of day they work in situations in which shift-work is performed. In Chapter 52, "Strategies for Troubleshooting Network Problems," you will find additional information regarding analyzing and segmenting groups of users according to their use of network resources. Understanding the protocols that are used is also important. A simple problem that can be hard to figure out occurs when you move a device to a different network segment and are unaware that it is using a nonroutable protocol. Most routers can be configured to pass these nonroutable protocols (such as NetBEUI), but you need to be aware of this and configure the router accordingly before you make the move. Finally, baseline data is never going to be something that is cast in stone and unchangeable. Modify your documentation as the network grows or changes so that the data remains useful. Statistical DataAlthough most analyzers provide a wide range of statistical data, the analyzer should be able to give you a few general values. First, be sure that the analyzer can give you statistics that tell you the utilization of the network. In addition to a real-time graphical display, you should also look for the capability to monitor the network and tell you when peak utilization occurs. That is, what times during the day does the network reach its busiest points? Overall utilization calculated over the average workday might not be nearly as helpful as identifying the periods of time when users are working their hardest and getting frustrated with a bogged-down network. Using peak utilization statistics, you can work to resolve the traffic problems by reallocating resources, or perhaps rearranging work habits of the user base. Another statistic that is found on most analyzers is Frames Per Second (FPS). By itself, FPS isn't a revealing value, but when combined with data showing the size of packets traversing the network, it can produce meaningful data. The larger the packet size used by a protocol, the more efficient the protocol is likely to be. This is because each packet requires overhead necessary to implement the protocol, such as addressing and error-checking information. With a larger packet size, the ratio of overhead to payload is reduced. Protocol DecodingThe capability to take the raw bits that travel on the network and present them on a frame-by-frame basis is a powerful feature of the analyzer. Looking at a stream of byte values isn't very useful when troubleshooting a network problem. Looking at each frame , and understanding what kinds of frames are being generated by devices on the network, is a necessary component of a network analyzer. Look for an analyzer that gives both a summary and a detailed view of the frame. The summary view usually shows just the addressing and header portion of the packet, whereas the detailed view displays every byte contained in the frame. FilteringFiltering is a necessary component for any network analyzer. Filtering allows you to set criteria that the analyzer uses when it captures frames, or to selectively search through a buffer of captured data to retrieve only those frames that are pertinent to your troubleshooting efforts. Filters can usually be set to select frames by protocol type, frame type, and protocol address or MAC addresses. Some allow you to search for specific data patterns throughout the entire packet. Software-Based AnalyzersSoftware analyzers are the cheapest route for large, complex networks. Because processors have scaled to much greater speeds and network adapters can capture packets from the fastest LAN speeds, software analyzers are now catching up to hardware-based analyzers. And you can find some freeware analyzer products on the Web that perform some or all of the functions you might need in a small network. Windows NT 4.0 through Windows 2003 servers come with a network monitor tool that enables the local workstation or server to monitor network traffic that is generated by or sent to the computer. The version that comes with the Systems Management Server (SMS) allows the network administrator to monitor all traffic on the LAN , using a feature referred to as promiscuous mode . The Windows 2000 Servers and Windows 2003 Servers network monitor can be found in the Administrative Tools folder. Both of these products allow you to capture data on the LAN, filter, and troubleshoot many kinds of problems. Because these products run on a workstation, you can use them to collect and store large amounts of information for immediate analysis and long- term reporting. In Figure 53.1, you can see the main window of the Network Monitor for Windows Server 2003 (called the Capture Window). Figure 53.1. The Capture Window shows a summary of the frames that have been captured by Network Monitor.
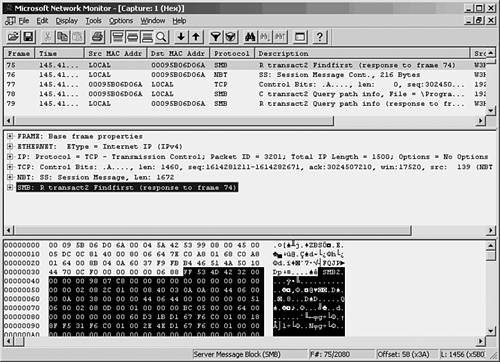
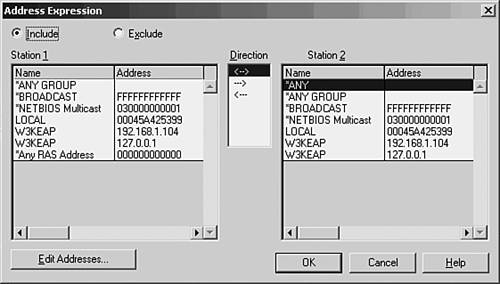
To begin capturing frames on the network, choose Capture, Start. You can also use the Capture menu to pause or stop the capture process. As frames are captured by the monitor, you can get an idea of what is happening on the network by the continuously updated bar graphs in the Capture Window. To view the actual data being collected, you can stop the capture process by selecting Capture, Stop. Choose Capture, Display Captured Data to view the frames captured (see Figure 53.2). Figure 53.2. The summary view window allows you to examine the captured data. As you can see, a summary line is provided for each frame that the monitor captured. You can scroll up or down to view all frames in the buffer. At this point, the frames are stored in a temporary buffer. If you only need to view the data for immediate analysis and then discard it, you can do so from this window. If you want to store the data for later analysis, select File, Save As. To view data in a stored file, choose File, Open to read the data in the file into the temporary buffer. To examine any of the captured frames and view it in detail, double-click it in the summary window. The window opens a Detail pane that shows the kinds of data in the frame. Click the plus sign (+) to expand the list of data contained in the frame. Figure 53.3 is an example of an ICMP (Internet Control Message Protocol) frame generated during a PING operation. By highlighting the ICMP portion of the Detail pane (in the center of this figure), the monitor highlights the data pertaining to this in the data section at the bottom of the figure. By showing the bytes that make up different parts of the frame, the monitor makes your job easier. Figure 53.3. You can examine the actual contents of the frame from this view. Capture and Display FiltersThe amount of traffic that passes through even a small network can be overwhelming, but not when you're using a network monitor to watch statistical information about current traffic. When you are troubleshooting, however, it's helpful to be able to filter out the nonessential information so that you can examine only those frames that are pertinent to the problem at hand. For this purpose, most analyzers allow you to set up a filter that screens out all but the frames you want to view. A capture filter is used to create selection criteria for the frames that will be kept and stored in the temporary buffer, whereas a display filter can be used to further select frames from those that are captured. Select Capture, Filter. In Figure 53.4, you can see the dialog box used to start creating a capture filter for the Network Monitor. Figure 53.4. Create a capture filter to specify which frames are copied to the temporary buffer. For a capture filter, you can specify specific protocols, address pairs, or patterns that occur in the frame itself. Figure 53.5 shows the dialog box used to select address pairs, and Figure 53.6 shows the dialog box used to specify a pattern. Figure 53.5. You can select the addresses that must appear in a frame in order for it to be selected for capture. Figure 53.6. Specify a pattern and an offset value for capturing frames based on pattern matching. When using pattern matching, you can specify a string that must be found in the frame before it is considered a candidate for capture. You can specify an offset value also, which indicates a starting point for the filter in the frame when it searches for the pattern. Capture TriggersAfter you create a capture filter, you can begin to capture data based on it by selecting Capture, Start. When using a narrow filter to look for a specific problem that doesn't occur often, you can set up an event to notify you when a matching frame is finally detected instead of having to sit at the console and wait. To set a capture trigger, select Capture, Trigger. The Network Monitor allows you to monitor overall traffic on the network by watching the graphs displayed in the Capture Window, and it allows you to look at specific frames to determine where problems exist. Similar to a hardware LAN analyzer, a good software LAN analyzer can be a valuable tool for determining network use or for troubleshooting specific protocol problems. Still, to view all network traffic, you'll need another network monitor, such as that included with Microsoft's SMS, or a third-party-product. Other Software LAN Analyzer ProductsThe fast microprocessors used in today's desktop and laptop computers allow for a wide range of software products to provide functionality that used to be primarily the domain of hardware-based analyzers. The preceding section looked at the built-in LAN monitoring tools available as part of the Windows operating system. However, a large market exists for software-based LAN analyzers, and they are usually much less expensive to deploy than their hardware counterparts. Before investing in a software LAN analyzer, you should try before you buy. Following is a list of a few good products that allow you to either download a demonstration version or order a CD that you can use to evaluate the product before making a purchase. Don't buy the first product you look at. Instead, determine whether the documentation is up to par, whether the company provides good technical support, and, most important, whether the product is intuitive and easy to use.
This is only a short list of the large number of products available, and they are not rated as to which is best because it depends on your needs and how your network is laid out. However, you should download the demos listed here so that you can get an idea of what you can expect from a software-based LAN analyzer. If you're going to spend money on such a product, make sure it's an informed purchase. Hardware AnalyzersThis type of instrument can cost as much as tens of thousands of dollars. Hardware analyzers, however, provide functionality in a critical situation that might not be obtainable from a software-based product. A hardware LAN analyzer can be taken to the location where a problem exists and be connected to the network to perform its functions. A hardware instrument will most likely be better able to cope with a high-speed environment, such as 100BASE-T and 1000BASE-T, than a software application that relies on a standard network adapter card to get traffic from the network medium. Hardware analyzers contain special circuitry that is used to perform many functions must faster than can be done via software, and are usually more reliable. Another thing to consider when comparing hardware to software analyzers is that when you use a PC or a workstation to act as your LAN analyzer, it might be limited as to what the NIC can do. For example, some ordinary adapter cards have built into their firmware a function that automatically discards certain kinds of packets that contain errors. If you are trying to detect what errors are causing problems on your network while troubleshooting, a software product running on a workstation might not be able to help you. Also, although it's true that network adapter cards can literally see every packet on the network as it zips by, that doesn't mean that the cards are capable of capturing the data and passing it up to higher-level protocols. When a card does capture all frames and pass them up the protocol stack, it is operating in promiscuous mode . Some cards are designed specifically not to do this, so be sure to check the documentation that comes with the one you might want to use on a workstation that will host LAN monitoring software.
Hardware analyzers are expensive because they usually do a very good job and are designed specifically for what they do. Most have built-in disk drives to store captured data, including a floppy disk drive that can be used to exchange data with PC workstations. Be sure that the instrument has enough memory to buffer significant amounts of data. Another feature to look for is a good display so that you can monitor utilization graphically as well as display the contents of individual frames. A hybrid analyzer that combines the best of the hardware and software products is also available. This type of device implements the capturing and filtering functions in a hardware component that attaches to a workstation, which then provides the display and storage functions. The hardware component has dedicated circuitry and processing power to capture data from the wire, and a software application on the PC is used to filter, calculate, and display the data. This type of device can be external to the PC, although some are implemented as cards that plug into the system's bus. |
EAN: 2147483647
Pages: 434