Chapter 5: Gathering System Information
|
Before you learn how to configure your system, you should learn how to gather essential system information. For example, you should know how to find the amount of free memory, the amount of available hard-drive space, how your hard drive is partitioned, and what processes are running. This chapter describes how to retrieve this type of information from your Red Hat Linux system using simple commands and a few simple programs.
System Processes
The ps aux command displays a list of current system processes, including processes owned by other users. This list is a static list; in other words, it is a snapshot of what is running when you invoked the command. If you want a constantly updated list of running processes, use top as described below.
The ps output can be long. To prevent it from scrolling off the screen, you can pipe it through less:
ps aux | less
You can use the ps command in combination with the grep command to see if a process is running. For example, to determine if emacs is running, use the following command:
ps ax | grep emacs
The top command displays currently running processes and important information about them, including their memory and CPU usage. The list is both real-time and interactive. An example of top’s output is provided as follows:
6:14pm up 2 days, 19:29, 5 users, load average: 0.10, 0.06, 0.07 71 processes: 68 sleeping, 2 running, 1 zombie, 0 stopped CPU states: 2.7% user, 0.5% system, 0.0% nice, 96.6% idle Mem: 256812K av, 252016K used, 4796K free, 97228K shrd, 43300K buff Swap: 265032K av, 1328K used, 263704K free, 86180K cached PID USER PRI NI SIZE RSS SHARE STAT %CPU %MEM TIME COMMAND 15775 joe 5 0 11028 10M 3192 S 1.5 4.2 0:46 emacs 14429 root 15 0 63620 62M 3284 R 0.5 24.7 63:33 X 17372 joe 11 0 1056 1056 840 R 0.5 0.4 0:00 top 17356 joe 2 0 4104 4104 3244 S 0.3 1.5 0:00 gnome-terminal 14461 joe 1 0 3584 3584 2104 S 0.1 1.3 0:17 sawfish 1 root 0 0 544 544 476 S 0.0 0.2 0:06 init 2 root 0 0 0 0 0 SW 0.0 0.0 0:00 kflushd 3 root 1 0 0 0 0 SW 0.0 0.0 0:24 kupdate 4 root 0 0 0 0 0 SW 0.0 0.0 0:00 kpiod 5 root 0 0 0 0 0 SW 0.0 0.0 0:29 kswapd 347 root 0 0 556 556 460 S 0.0 0.2 0:00 syslogd 357 root 0 0 712 712 360 S 0.0 0.2 0:00 klogd 372 bin 0 0 692 692 584 S 0.0 0.2 0:00 portmap 388 root 0 0 0 0 0 SW 0.0 0.0 0:00 lockd 389 root 0 0 0 0 0 SW 0.0 0.0 0:00 rpciod 414 root 0 0 436 432 372 S 0.0 0.1 0:00 apmd 476 root 0 0 592 592 496 S 0.0 0.2 0:00 automount
To exit top, type q. Useful interactive commands that you can use with top include those shown in Table 5-1.
| Command | Description |
|---|---|
| Space | Immediately refresh the display |
| h | Display a help screen |
| k | Kill a process. You will be prompted for the process ID and the signal to send to it. |
| n | Change the number of processes displayed. You will be prompted to enter the number. |
| u | Sort by user. |
| M | Sort by memory usage. |
| P | Sort by CPU usage. |
| Tip | Applications such as Mozilla and Nautilus are thread-aware — multiple threads are created to handle multiple users or multiple requests, and each thread is given a process ID. By default, ps and top display only the main (initial) thread. To view all threads, use the command ps -m or press Shift-H in top. |
If you prefer a graphical interface for top, you can use the GNOME System Monitor. To start it from the desktop, select Main Menu Button (on the Panel) > System Tools > System Monitor or type gnome-system-monitor at a shell prompt from within the X Window System. Then select the Process Listing tab.
The GNOME System Monitor allows you to search for a particular process in the list of running process as well as view all processes, your processes, or active processes. To learn more about a process, select it and click the More Info button. Details about the process will be displayed at the bottom of the window.
To stop a process, select it and click End Process. This function is useful for processes that have stopped responding to user input. To sort by the information in a specific column, click on the name of the column. The name of that column then appears in a different shade than the names of the other columns in the window.
By default, the GNOME System Monitor does not display threads. To change this, select Edit > Preferences, click the Process Listing tab, and select Show Threads. This screen also allows you to configure the update interval, what type of information to display about each process by default, and the colors of the system monitor graphs.
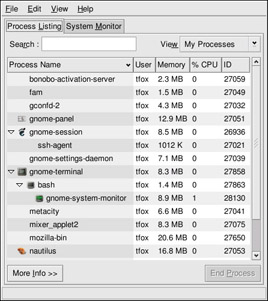
Figure 5-1: GNOME System Monitor
|
EAN: 2147483647
Pages: 278