| Some of the most exciting features of any IDE are the debugging features. To take advantage of these features, you must make sure that you built your executable using a Debug configuration. There are two ways to enter the debugger: -
Just-in-Time Debugging: You run as normal, and if an exception occurs, you will be allowed to enter the debugger. The program has crashed, so you will not be able to run any further. But you will be able to see the value of variables , and you will see the point at which the program failed. -
Standard Debugging: You start the program under the debugger. You may set breakpoints, single step, and so on. To experiment with the debugger, add the following two lines to your program after the calculation of gigabytes:  bytes = bytes * 1024 Console.WriteLine("1 terabyte = {0} bytes", bytes) bytes = bytes * 1024 Console.WriteLine("1 terabyte = {0} bytes", bytes) Then rebuild the application. You can find this version of the program in Bytes\Version2 . Just-in-Time Debugging Build and run (without debugging) the Bytes program from the preceding section, making sure to use the Debug configuration. This time, the program will not run through smoothly to completion, because an exception will be thrown. A Just-In-Time Debugging dialog will appear (see Figure A-10). Click Yes to debug. Figure A-10. Just-In-Time Debugging dialog is displayed in response to an exception. 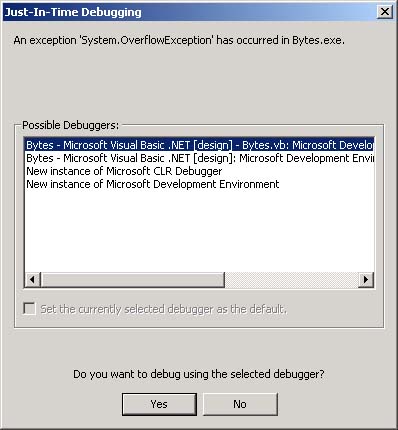 The Attach to Process dialog will then be displayed (see Figure A-11). Click OK to debug. Figure A-11. Attach to Process dialog. 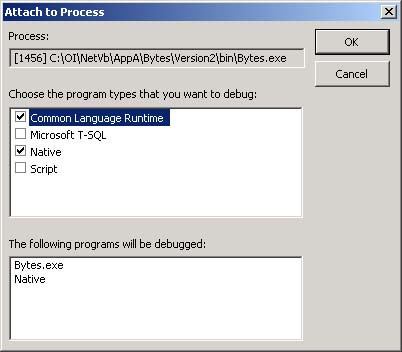 Finally, the Microsoft Development Environment dialog will be displayed (see Figure A-12). Click Break to debug. If you originally executed the program using Start instead of Start Without Debugging, the dialogs in Figure A-10 and Figure A-11 will not be displayed. Figure A-12. Microsoft Developer Environment options for responding to exceptions. 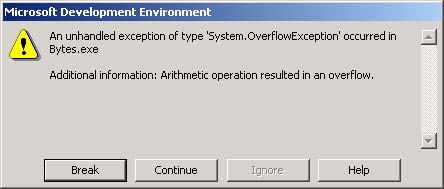 You will now see a window showing the source code where the problem arose, with an arrow pinpointing the location (see Figure A-13). Figure A-13. Breaking on a System.OverflowException. 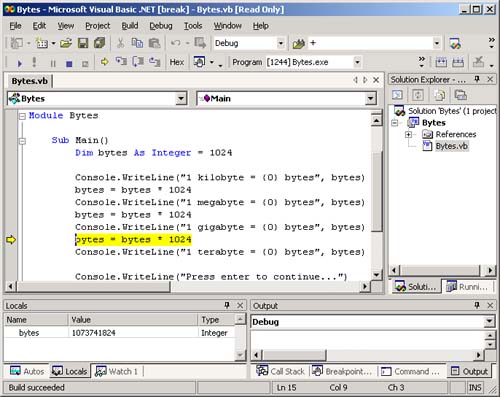 If you look in the Locals window, which is docked across the bottom of the Visual Studio window (click on the Locals tab at the bottom), you will see that the current value of the variable bytes is 1073741824. When the expression bytes * 1024 was executed, the resulting value was larger than the largest possible integer. This is why the exception indicated that you had an overflow . To stop debugging, you can use the  toolbar button or the menu Debug Stop Debugging. toolbar button or the menu Debug Stop Debugging. Standard Debugging Breakpoints Typically, when you want to debug, you set a breakpoint at a line in the code where you want to begin to follow the execution. Then you run using the debugger. As an example, set a breakpoint at the first line: bytes = bytes * 1024 The easiest way to set a breakpoint is to click in the gray bar to the left of the source code window. You can also set the cursor on the desired line and click the "hand" toolbar button  to toggle a breakpoint. (It sets a breakpoint if one is not set, and removes the breakpoint if a one is set.) to toggle a breakpoint. (It sets a breakpoint if one is not set, and removes the breakpoint if a one is set.) Now you can run under the debugger. Execution begins in Main and pauses when the breakpoint is hit. A yellow arrow over the red dot of the breakpoint shows the next line to be executed. See Figure A-14. Figure A-14. A breakpoint has been hit. 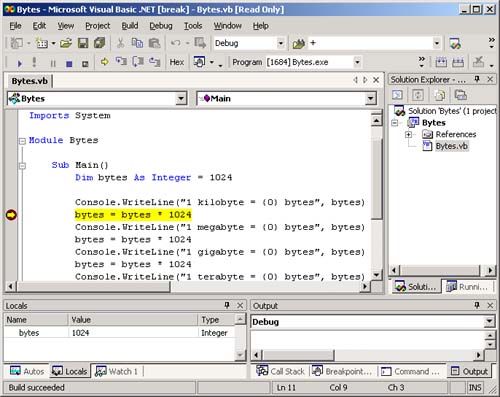 When you are finished with a breakpoint, you can remove it by clicking again in the gray bar or by toggling with the hand toolbar button. If you want to remove all breakpoints, you can use the menu Debug Clear All Breakpoints, or you can use the toolbar button  . . Watching Variables At this point, you can inspect variables. Several options are available to accomplish this: Locals window, tool tips, Quick Watch window, and Watch window. You have already seen in Figure A-13 and Figure A-14 the Local window that is displayed when a breakpoint is encountered . It lists all the variables that are defined in the current procedure, as well as their current values. If you don't see the Locals window, you can use the menu Debug Windows Locals to bring up the window. Another easy way to examine the value of a variable is to hover the mouse over the variable. The value of the variable will be shown as a yellow tool tip, as illustrated in Figure A-15. Figure A-15. Using tool tips to show a variable's value. 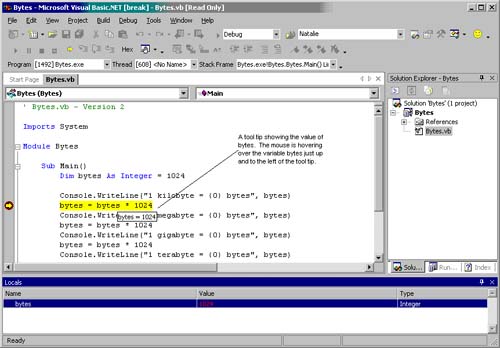 You can also right-click over a variable and choose Quick Watch (or use the eyeglasses toolbar button  ). Figure A-16 shows a typical Quick Watch window. You can also change the value of a variable from this window. ). Figure A-16 shows a typical Quick Watch window. You can also change the value of a variable from this window. Figure A-16. The Quick Watch window shows the variable, allowing you to change it. 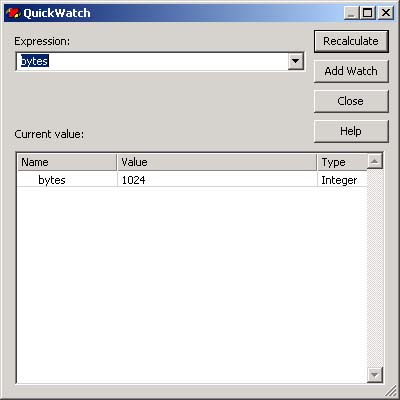 Finally, you can use the Watch window to manage a custom list of variables you want to watch. To add a variable to the Watch window, right-click on it and choose Add Watch. The Watch window is similar to the Locals window, and it stays docked at the bottom of the Visual Studio window. When a variable changes value, the new value is shown in red. Figure A-17 shows the Watch window. (Note that the display has been changed to hex, as described in the next section.) Figure A-17. The Visual Studio Watch window. 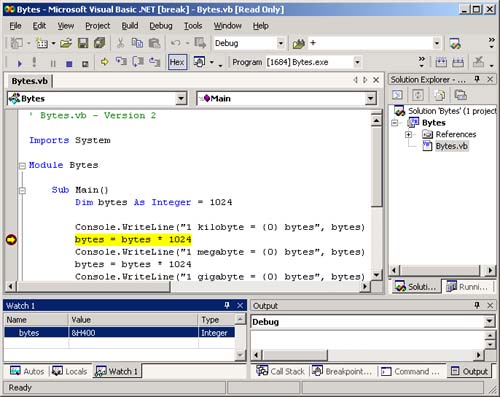 Debugger Options You can change debugger options by choosing from the menu Tools Options and then selecting Debugging from the list. Figure A-18 illustrates setting a hexadecimal display. If you then go back to a Watch window, you will see a hex value such as 0x400 displayed. [2] [2] You could also simply right-click over the value in the Locals or Watch window and choose Hexadecimal Display from the context menu. Figure A-18. Setting hexadecimal display in Debugging Options. 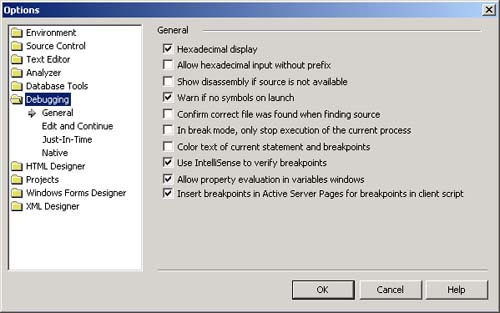 Another useful debugging option to change under the Edit and Continue category allows you to edit code while your are in Break mode (see Figure A-19). This option is automatically set for C# projects, but not for VB projects. Figure A-19. Setting Edit and Continue options. 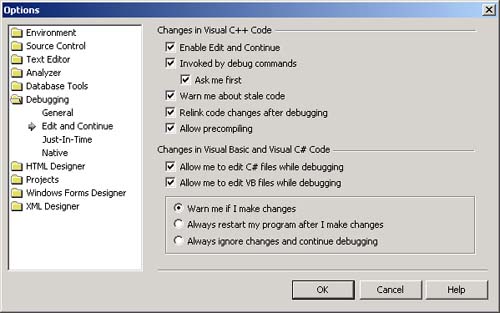 Single Stepping When you are stopped in the debugger, you can single step through the code. This means that you can execute one line at a time and examine the results of each statement. You can also begin execution by single stepping. There are a number of single step buttons :  . These are the most common (in the order shown on the toolbar): . These are the most common (in the order shown on the toolbar): -
Step Into -
Step Over -
Step Out There is also a Run to Cursor  . . With Step Into, you execute the current statement. If it is a call to a procedure, execution will step into the procedure. With Step Over, you execute current statement. If it is a call to a procedure, it will execute the entire procedure. | | To illustrate Step Into, build the Bytes\Version3 project, where the expression bytes * 1024 has been replaced by a call to the function MultiplyByOneK . Set a breakpoint at the first function call, and then select Step Into. The result is illustrated in Figure A-20. Note the red dot at the breakpoint and the yellow arrow in the function. | Figure A-20. Stepping into a function. 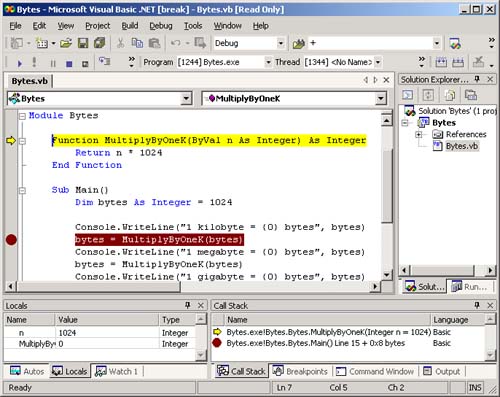 When debugging, Visual Studio maintains a call stack. You can display the call stack by using the menu Debug Windows Call Stack. In our example, the Call Stack is just two deep when you used Step Into to step into the function. See the Call Stack pane in Figure A-20. It shows that the Main function called MultiplyByOneK . Stop debugging and start again. But instead of choosing Step Into, choose Step Over. You will see that you are immediately placed on the call to WriteLine . | 