Monitoring WebLogic Server Applications
Before we discuss how to manage applications, we are going to cover some techniques for monitoring WebLogic Server applications. Fortunately, WebLogic Server provides numerous tools and techniques for monitoring different aspects of a distributed application. This section starts off by introducing another command-line administration tool, weblogic.Admin . Next , we look into areas of the WebLogic Console that allow you to monitor the run-time behavior of the server and your applications. We will spend a little time discussing the Java Management Extensions (JMX) APIs, which provide programmatic access to most configuration capabilities as well as run-time monitoring. We finish off the section by briefly touching on the SNMP capabilities of WebLogic Server.
Using the Command-Line Administration Tool
WebLogic Server offers access to most administrative functionality through a command-line administration tool called weblogic.Admin . Through this tool, you can do almost everything from basic sanity checks for things like version information, connectivity, and latency, to issuing JMX commands to alter the configuration of a server. Although we will discuss this tool in multiple places throughout the rest of this chapter, we will not attempt to cover every possible option exhaustively. For more information, see the WebLogic Server documentation at http://edocs.bea.com/wls/docs81/admin_ref/cli.html .
As with the deployer tool, the admin tool requires that the same Java system parameters be defined to support using the SSL protocol to communicate with the administration port on the admin server. In addition, the admin tool requires certain command-line options for every command. Therefore, we will create another script called weblogicAdmin.cmd to automate the process of invoking this program. Once again, we will place this script in the Chapter 11 examples directory ( c:\mastering\ch11_examples ):
@SETLOCAL @call setEnv.cmd @if %URL% == set URL=t3s://192.168.1.20:9002 @java -Dweblogic.security.SSL.trustedCAKeyStore=ClientTrustStore.jks weblogic.Admin -url %URL% -username system -password insecure %* @ENDLOCAL
Unlike the deployer tool, some commands in the admin tool support talking directly to the managed servers through their admin port. For example, you can use the admin tool to check the WebLogic Server software version information for Server1 using the following commands:
> set URL=t3s://192.168.1.21:9002 > weblogicAdmin VERSION WebLogic Server 8.1 Thu Mar 20 23:06:05 PST 2003 246620 WebLogic XMLX Module 8.1 Thu Mar 20 23:06:05 PST 2003 246620
Now, let s look at some of the monitoring capabilities of the admin tool. We have already seen how to get the WebLogic Server software version information from a specific server. We can also look at the licenses for the server using the LICENSES command. Like the VERSION command, the LICENSES command takes no additional arguments and returns the license information for the server to which we send the command. The GETSTATE command displays the status of a particular server, either by asking the server itself or by asking the admin server, as shown here:
> set URL= > weblogicAdmin GETSTATE Server3 Current state of Server3 : RUNNING
To verify that a server is accepting connections and processing requests , we can use the PING command. This command connects to the targeted server, sends one or more requests to the server, waits for the server to respond to each request, and measures the round-trip time. These ping requests go through the same mechanism as other requests in that they get placed onto the default execute queue and an execute thread picks up the request and returns the response to the caller. Using the optional arguments of the PING command that specify the number of requests and the size of each request (in bytes), you can use this tool to measure server response time to these empty ping requests, as shown here:
> set URL= t3s://192.168.1.21:9001 > weblogicAdmin PING 1000 10000 Sending 1,000 pings of 10,000 bytes. RTT = ~6309 milliseconds, or ~6 milliseconds/packet
The results indicate that the total round-trip time (RTT) was about 6.3 seconds, so, on average, the server is processing these empty ping requests in about 6 milliseconds. By looking at the latency of processing these empty requests, you can determine if the server itself is being overloaded during periods of slower-than-normal system response time. This tool is an extremely important diagnostic tool because it enables you to see if, and how quickly, the server is processing requests in the default execute queue.
The LIST command allows you to list all of the objects bound into a particular location in the JNDI tree. Simply specify the JNDI context name , and the LIST command will print a textual representation of all subcontexts and objects, and their names , as shown here:.
> weblogicAdmin LIST javax/transaction Setting credentials Contents of javax/transaction UserTransaction: weblogic.transaction.internal.ClientTransactionManagerImpl TransactionManager: weblogic.transaction.internal.ClientTransactionManagerImpl
The SERVERLOG command allows you to look at portions of a server s log file. To use this command, you need to point directly at the server in question and specify the start and end times of the entries in which you are interested using the YYYY/MM/DD HH:MM format, as shown here:
>weblogicAdmin SERVERLOG 2003/04/12 11:00 2003/04/12 13:00 BEA-000213 Apr 12, 2003 12:59:56 PM CDT Info WebLogicServer Adding address: 192.168.1.20 to licensed client list BEA-000360 Apr 12, 2003 12:59:21 PM CDT Notice WebLogicServer Server started in RUNNING mode ...
Notice that the entries are displayed in reverse chronological order. At the time of writing, the SERVERLOG command displays a maximum of 500 entries and does not provides an option to change this setting. This may change by the time you read this, so check the WebLogic Server command-line interface documentation at http:// edocs.bea.com/wls/docs81/admin_ref/cli.html for more information.
The last monitoring command we will discuss is the THREAD_DUMP command. In certain situations, the server may slow down or even become unresponsive . Another important debugging tactic is looking at the call stacks of the server s threads to determine exactly what they are doing. Although there are other ways to generate a thread dump, the admin tool command is a simple one that does not require operating system-specific knowledge. In certain situations (for example, running the server via the node manager on a Windows platform), this command may be the only way to get a thread dump. Much like the VERSION , LICENSES , PING , and SERVERLOG commands, the target server must receive the THREAD_DUMP command directly. The results of the thread dump are written to the stderr output stream of the server.
We will come back to the admin tool in later sections. For now, let s move on to the WebLogic Console to look at some of its monitoring capabilities.
Monitoring with the WebLogic Console
Most of our use of the WebLogic Console so far has focused on configuration. The WebLogic Console also offers a rich set of monitoring capabilities. In this section, we will highlight some of these capabilities that provide insight into the behavior of the application, as well as WebLogic Server. Covering all of the monitoring capabilities of the WebLogic Console in detail is beyond the scope of this book. Please refer to the WebLogic documentation at http://edocs.bea.com/wls/docs81/ConsoleHelp/index.html for more information.
Let s start by discussing the most basic, yet one of the most important, monitoring features of the WebLogic Console. When running a WebLogic Server application, you often need a glimpse inside the server to get a feel for how well it is running. Use the server s Performance Monitoring tab to get a look at the request throughput, execute queue backlog, and the JVM heap usage. Looking at Figure 11.8, you see that the request throughput is averaging around 240 requests per second in this example display.
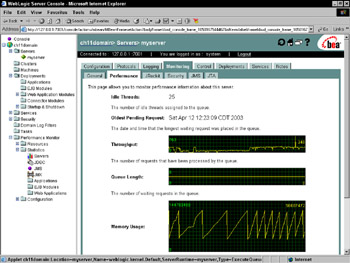
Figure 11.8: Monitoring server performance.
The execute queue length is zero, which means that we never have more concurrent requests waiting than we have available execute threads to process them. Although this is the optimal situation, it will not always be achievable for actual production systems. The bottom graph shows frequent spikes in memory usage. In this case, the heap size is probably too small, or the garbage collector needs tuning, or both, to try to minimize the frequency of the peaks of high heap usage. See the discussion of JVM tuning in Chapter 12 for more information on how to minimize this behavior.
At the time of writing, these graphical execute queue monitoring capabilities are only for each server s default execute queue. You can also get snapshots of the current statistics for all execute queues by selecting the Monitor all Active Queues link on the server s General Monitoring tab.
Much more run-time information about a server is available through the WebLogic Console. The Cluster Monitoring gives information about the membership of the cluster, replicated primary and secondary objects on each server, and multicast heartbeat message statistics. Using the Security Monitoring tab, you can view the statistics for failed logins, users that are locked out due to too many authentication failures, and other related information. The JTA Monitoring tab gives you access to transaction statistics and allows you to monitor the particular transactions and view in-flight transactions. At the bottom of all of these monitoring tab pages are links to view the server s log file and its JNDI tree. If you are using the JRockit JVM to run the server, the server s JRockit Monitoring tab gives you a view into the JVM performance and garbage collection statistics.
Next, let s look at monitoring JDBC connection pools. Under a connection pool s Monitoring tab, the WebLogic Console provides a configurable view of each database connection pool s run-time statistics. Three particular parameters are especially important in diagnosing the health of your WebLogic Server application: Connections High , Wait Seconds High , and Waiters High . These parameters are not shown by default, but you can add them by using the Customize this view link.
Connections High tells you the maximum number of connections reached in the pool at any time since the server started. By comparing this number with your pool s Initial Capacity and Maximum Capacity settings, you can determine if the pool is sized properly for the application load the server has experienced . When all the connections in a pool are in use and the pool size is at its maximum value, a thread requesting a connection from the pool will have to wait until one becomes available or until it times out. The Waiters High value tells you the maximum number of threads that were waiting (at any particular point in time) to get a database connection from the pool because there were no connections available. Wait Seconds High tells you the longest time a thread had to wait to get a connection. If you are using a non-negative value for Connection Reserve Timeout , realize that Wait Seconds High will never exceed this value. If your database connection pool shows non-zero values for Waiters High or Wait Seconds High , you should consider increasing the size of your database connection pool.
WebLogic Server pools EJB instances. The weblogic-ejb-jar.xml deployment descriptor controls the size of the pool. Because stateless session bean instances do not have any client-specific conversational state, the server assigns each request to a bean instance only for the duration of the method call. Idle instances reside in a pool. Because the EJB specification prohibits two threads from using the same bean instance at the same time, the container must synchronize access to each bean instance. This means that if the maximum number of beans in the pool is too small, the container must block calling threads until a bean instance becomes available. Obviously, this situation is undesirable because it will impact performance. The EJB application s Stateless EJBs Monitoring tab provides you with statistics concerning the pool. The Pool Waiter Total Count tells you the cumulative number of times a thread had to wait for a bean instance because none was available. Pool Timeout Total Count tells you the number of threads that have timed out waiting for a bean instance. Fortunately for stateless session beans, the default value of the max-beans-in-free-pool deployment descriptor element that controls the pool size is the maximum integer value so this problem will occur only if the value is explicitly set too small.
For stateful session beans, the server does not pool idle instances, but it does maintain a cache of recently used bean instances. As this cache starts to fill up, WebLogic Server will passivate bean instances to make room for other instances by writing the bean s state to disk, as discussed in Chapter 6. The next time a request comes in for a passivated bean, the container must read the bean s state in from disk before dispatching the request to the bean. As you might imagine, this can have a significant impact on performance. By default, the max-beans-in-cache deployment descriptor element that controls the cache size is set to 1,000 instances. Whenever the container must activate or passivate a bean instance, it updates internal statistics that can be seen using the EJB application s Stateful EJBs Monitoring tab. For stateful session beans, you should keep an eye on the Activation Count . The container passivates bean instances when appropriate, but the cost of reactivating these beans can slow down your application tremendously. If the Activation Count for a particular bean is high, you should consider increasing the size of the cache.
Entity beans have both a free pool and a cache. The container uses the free pool of bean instances to invoke finder methods, home methods, create methods , and the cache to hold in-use or recently used instances. While the container never passivates an entity bean s state to disk (because its state already exists in the underlying database), it does remove bean instances from the cache whenever it needs space for other instances. Entity beans have several configuration options that can affect both the optimum size and importance of the cache, such as the concurrency strategy and the cache-between-transactions deployment descriptor setting. Rather than cover the details here, please refer to the discussion of these topics in Chapter 6 and the WebLogic Server documentation at http://edocs.bea.com/wls/docs81/ejb/EJB_environment.html .
The EJB application s Entity EJBs Monitoring tab allows you to monitor the statistics necessary to help you determine the optimum pool and cache sizes. The Pool Waiter Total Count and Pool Timeout Total Count numbers work just as they do for stateless session beans. The Cache Miss Ratio tells you how frequently the application went to access an entity bean that was not in the cache. For entity beans that use the exclusive concurrency strategy, the Lock Mgr. Waiter Total Count and Lock Mgr. Timeout Total Count allow you to see just how much contention the application is experiencing for instances of a particular bean.
WebLogic JMS also supports monitoring through the WebLogic Console. The JMS server s monitoring tab links to monitor JMS servers, destinations, and session pools. Two of the most important statistics to look at for JMS servers and destinations are the Bytes Threshold Time and Messages Threshold Time . These values will tell you how much time the JMS server or destination has spent controlling flow and/or paging because the upper threshold was crossed. For more information about JMS monitoring, see Chapter 9 and the WebLogic Server documentation at http://edocs.bea.com/wls/docs81/ConsoleHelp/jms_monitor.html .
WebLogic Server 8.1 Service Pack 1 adds more monitoring capabilities to the WebLogic Console, which you will find in the Performance Monitoring folder. This new functionality allows you to monitor the machine, JVM, server, and applications all through the WebLogic Console. As shown in Figure 11.9, this new feature also allows you to view performance information about your application components and classes. At the time of writing, this feature is still evolving so we will not spend any more time covering its use. Please refer to the WebLogic Server documentation for more information.
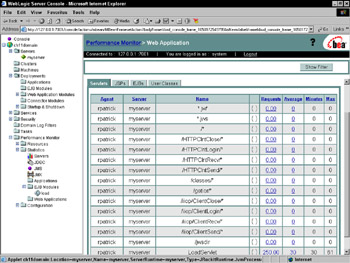
Figure 11.9: Monitoring execute queue statistics.
At this point, we have touched on the most important monitoring features of the WebLogic Console. These features provide a quick insight into the operation of your application so that you can determine if configuration changes may help to improve performance or reduce resource consumption. Now, we are ready to move on to talk about WebLogic Server s JMX support.
Programmatic Monitoring with JMX
WebLogic Server implements the Java Management Extensions (JMX) specification and provides JMX-based services to manage server and application resources. While the WebLogic Console can be thought of as a user interface to JMX, the real power of JMX is the ability to programmatically manage resources through either a Java program or from a script using one of the available administrative tools that support JMX. A complete discussion of JMX and JMX programming is beyond the scope of this book; please refer to the WebLogic Server documentation at http://edocs.bea.com/wls/docs81/jmx/index.html and the JMX documentation at http://java.sun.com/products/JavaManagement/ for more information.
When you are trying to use the JMX interface to access WebLogic Server administrative functionality, the weblogic.management packages will be very useful (see http://edocs.bea.com/wls/docs81/javadocs/index.html) as these classes provide strongly typed access to the JMX functionality and thus are easier to use than the loosely typed, pure JMX APIs.
In this section, we will show how to get the execute queue length and calculate the execute queue throughput and percentage of the JVM heap currently in use using WebLogic JMX. To execute JMX commands, you will need to authenticate to the server. While we will not revisit Chapter 10 s discussion of JAAS authentication, we will use the WebLogicLoginHelper class from the book s companion Web site to handle the authentication so that we can focus on JMX programming here. In the interest of space, we do not list the entire WebLogicPerformanceMonitor class, but it is available on the companion Web site at http://www. wiley .com/compbooks/masteringweblogic . Let s walk through the important parts of this program that are related to JMX.
The first thing that you need to do once you log in is to look up the MBeanHome for the server you want to monitor. If you wanted to monitor Server1, the code would look like this:
import weblogic.management.MBeanHome; ... MBeanHome home = (MBeanHome)ctx.lookup(MBeanHome.JNDI_NAME + . + serverName);
Once you have the correct MBeanHome object, you can use it to obtain the ExecuteQueueRuntimeMBean for the default execute queue and the JVMRuntimeMBean , using the following code:
import javax.management.InstanceNotFoundException; import weblogic.management.runtime.ExecuteQueueRuntimeMBean; import weblogic.management.runtime.JVMRuntimeMBean; ... try { ExecuteQueueRuntimeMBean executeQueue = (ExecuteQueueRuntimeMBean) home.getRuntimeMBean(weblogic.kernel.Default, ExecuteQueueRuntime); JVMRuntimeMBean jvm = (JVMRuntimeMBean) home.getRuntimeMBean(serverName, JVMRuntime); } catch (InstanceNotFoundException infe) { ... } Now, use the methods of these two objects to get the attributes that are of interest. For example, the following line of code will provide the length of the execute queue from the ExecuteQueueRuntimeMBean :
int executeQueueLength = executeQueue.getPendingRequestCurrentCount();
That is really all there is to using JMX to read information. As we will see later, the JMX code to modify configuration information is a little more involved, though it is still relatively simple. You should download the WebLogicPerformanceMonitor example before proceeding.
The WebLogicPerformanceMonitor program takes one argument, the name of the property file where we pass in the relevant information. Once the program reads the information from the property file, it then uses the Java Authentication and Authorization Service APIs (via the WebLogicLoginHelper ) to log in and execute the JMX code hidden in the getPerfStats() method. getPerfStats() first checks the length of the execute queue; if it is nonzero, it calculates the difference between the current time and the oldest request on the queue to estimate how long a request is waiting on the queue before an execute thread picks it up. Next, we determine the total number of processed requests at two different points in time to calculate the instantaneous request throughput. Finally, we get the current JVM heap size as well as the current amount of free heap to calculate the percentage of the heap currently in use.
To run this program, we need to create a property file that looks like the one shown here and pass the name of the property file to the WebLogicPerformanceMonitor class as an argument:
server_url=t3s://192.168.1.21:9002 server_name=Server1 username=system password=insecure
As always, when using a Java client to talk to WebLogic Server using SSL, you need to add the appropriate Java system property definitions to the command line. In our example, we use the property file name perfmon.properties and create a script called perfmon.cmd , as shown here:
@SETLOCAL @call setEnv.cmd @java -Dweblogic.security.SSL.trustedCAKeyStore=ClientTrustStore.jks mastering.weblogic.ch11.example2.WebLogicPerformanceMonitor perfmon.properties @ENDLOCAL
If you run the perfmon script while Server1 is under load, you will get results that look something like the ones shown here:
> perfmon username: system password: ******** URL: t3s://192.168.1.21:9002 The execute queue length is 0. The current throughput is 18.25168107588857 requests/second. The JVM heap is currently 94.75636790320637% full.
You can also use the weblogic.Admin tool to collect the same information from the server. Using our weblogicAdmin script, we can obtain the length of Server1 s default execute queue with the following command:
> set URL=t3s://192.168.1.21:9002 > weblogicAdmin GET -pretty -mbean bigrezdomain:Location=Server1,Name=weblogic.kernel.Default, ServerRuntime=Server1,Type=ExecuteQueueRuntime -property PendingRequestCurrentCount --------------------------- MBeanName: bigrezdomain:Location=Server1,Name=CSAExecuteQueue, ServerRuntime=Server1,Type=ExecuteQueueRuntime PendingRequestCurrentCount: 16
The most difficult thing in this technique is figuring out the name of the MBean. Fortunately, as long as you know the interface class of the MBean you want, you can specify the type of MBean and the server will return a list of all MBeans of that type along with their names. To determine the appropriate type name, simply remove the MBean suffix from the interface class name. Because the information we want is available via the weblogic.management.runtime.ExecuteQueueRuntimeMBean interface, the type name is ExecuteQueueRuntime . The following example shows the result of running the GET command with the ExecuteQueueRuntime type:
> weblogicAdmin GET -pretty -type ExecuteQueueRuntime --------------------------- MBeanName: "bigrezdomain:Location=Server1,Name=weblogic.kernel.Default, ServerRuntime=Server1,Type=ExecuteQueueRuntime" CachingDisabled: true ExecuteThreadCurrentIdleCount: 25 ExecuteThreads: [Lweblogic.management.runtime.ExecuteThread;@fb6354 Name: weblogic.kernel.Default ObjectName: weblogic.kernel.Default Parent: Server1 PendingRequestCurrentCount: 0 PendingRequestOldestTime: 1050184873220 Registered: true ServicedRequestTotalCount: 31 Type: ExecuteQueueRuntime --------------------------- MBeanName: "bigrezdomain:Location=Server1,Name=weblogic.admin.RMI, ServerRuntime=Server,Type=ExecuteQueueRuntime" CachingDisabled: true ExecuteThreadCurrentIdleCount: 1 ExecuteThreads: [Lweblogic.management.runtime.ExecuteThread;@e7c5cb Name: weblogic.admin.RMI ObjectName: weblogic.admin.RMI Parent: Server1 PendingRequestCurrentCount: 0 PendingRequestOldestTime: 1050184873250 Registered: true ServicedRequestTotalCount: 25 Type: ExecuteQueueRuntime ...
At this point, you have all the information you need to query WebLogic Server to get information via the JMX interface. Of course, the JMX interface also gives us the ability to create new configuration artifacts and to modify existing ones. We will see an example of this in the Managing WebLogic Server Applications section.
There are additional options available for integrating with JMX. WebLogic Server 8.1 provides an Ant task called wlconfig that provides a simpler scripting interface to JMX; see http://edocs.bea.com/wls/docs81/admin_ref/ant_tasks.html for more information on how to use wlconfig . WLShell is a freeware tool that provides an interactive shell environment and batch scripting capabilities for JMX programming with WebLogic Server. See http://www.wlshell.com to download the latest version of WLShell. We ll also take a brief look at these tools in Chapter 13 when we discuss the management of configuration information in the development environment.
Before we move on to management, let s have a quick look at WebLogic Server s SNMP support.
Monitoring via SNMP
WebLogic Server 8.1 supports Simple Network Management Protocol (SNMP) versions 1.0 and 2.0. An SNMP manager contacts the admin server, who acts as the SNMP agent for the entire domain. With proper configuration, the WebLogic SNMP agent can act as a proxy for other SNMP agents on the same machine (for example, an Oracle database agent). While complete coverage of WebLogic SNMP is beyond the scope of this book, we will try to cover the basic information needed to communicate with WebLogic Server using SNMP. For more information, please refer to the WebLogic SNMP Management Guide at http://edocs.bea.com/wls/docs81/snmpman/index.html and the WebLogic SNMP MIB Reference at http://edocs.bea.com/wls/docs81/snmp/index.html .
To use SNMP with WebLogic Server, you need to enable SNMP support using the domain s SNMP Configuration tab. Enabling SNMP support is as simple as checking the Enabled checkbox, selecting an SNMP Port , and restarting the admin server. By default, WebLogic SNMP uses port 161 to receive SNMP requests. The SNMP Port allows you to specify what port you want to use for SNMP traffic. Before restarting the server, let s talk about some of the other parameters on this tab.
SNMP uses passwords known as community names to authenticate SNMP requests. Because much of the WebLogic SNMP MIB data is available for each server in a domain (for example, the default execute queue length), you need some way for the SNMP manager to tell the WebLogic SNMP agent what data it wants. The way that WebLogic SNMP accounts for this is by piggybacking the server information with the community name. WebLogic Server s SNMP manager needs to send the community name in the form < community_name > @ < server_name >. You tell WebLogic SNMP what community name to expect from the SNMP manager via the Community Prefix parameter. To get information about the admin server itself, you can either specify the name of the admin server or omit the server name altogether. To get information from the entire domain, replace the server name with the domain name.
The admin server gathers data from the managed servers to respond to SNMP requests. For efficiency, the admin server caches this data for a period of time to prevent excessive communication with the managed servers. MIB Data Refresh Interval specifies the minimum amount of time to cache the collected information before refreshing it. Server Status Check Interval Factor specifies the number of MIB Data Refresh Interval s between the admin server s health checks of the managed servers. The Debug Level simply turns on extra debugging output on the admin server to help debug any SNMP problems between the SNMP manager and the WebLogic SNMP agent. Before talking about the last two items in the domain s SNMP Configuration tab, let s verify that the SNMP agent is working. To do this, you need to restart the admin server, so please do that now.
WebLogic Server does not provide an SNMP manager. For this purpose, we will use the AdventNet MIB Browser and Trap Viewer that come with the AdventNet SNMP API 4 product (available from http://www.adventnet.com/products/snmp/download.html). The MIB Browser allows us to interact with the WebLogic SNMP agent by sending SNMP GET requests to retrieve WebLogic Server configuration and run-time information. This is the same information available through the JMX APIs. WebLogic SNMP does not currently support the SNMP SET operation to make changes to the WebLogic Server configuration.
To communicate with the WebLogic SNMP agent, you need to load the WebLogic Server management information base (MIB) data into the MIB Browser. Using the MIB Browser application s File menu, select the Load MIB menu item, browse to the $WL_HOME/server/lib directory, and select the BEA-WEBLOGIC-MIB.asn1 file. After expanding the BEA-WEBLOGIC-MIB folder on the left, you should see a list of WebLogic SNMP MIB tables and attributes similar to those shown in Figure 11.10. Replace the Community entry with the string public@Server1 and perform an SNMP GET operation to get the names of the execute queues in Server1, as shown in Figure 11.10.
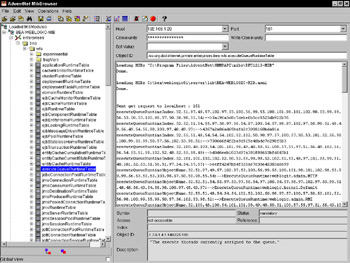
Figure 11.10: Viewing the WebLogic Server MIB.
All of this is interesting, but the main reason to use SNMP is to send unsolicited messages to the SNMP manager whenever something happens. These unsolicited messages are called SNMP traps . WebLogic SNMP can generate traps to notify the SNMP manager of certain types of events. WebLogic Server comes with a set of predefined traps for server startup, server shutdown, cold start (admin server startup), and authentication failure. You can also set up three other types of traps: attribute change traps, log message traps, and monitor traps. Before we talk about defining new traps, let s configure the WebLogic SNMP agent and the AdventNet Trap Viewer and verify that we are seeing traps propagate from WebLogic Server to the Trap Viewer.
The first step is to configure the Trap Viewer to listen for traps. Using the MIB Browser s View menu, select the Trap Viewer menu item. Use the Trap Viewer s Start button to tell it to start listening for traps on its default port, port 162, with a Community of public . Now, you need to configure the WebLogic Server side of things. Under the Services- > SNMP folder in the left-hand navigation bar, select Trap Destinations and create a new trap destination. Then, go back to the domain s SNMP Configuration tab and move the new trap destination into the Chosen column of the Targeted Trap Destinations attribute.
Now, let s test the trap mechanism by shutting down and restarting Server1. Trap Viewer eventually receives two traps, one for server shutdown and one for server startup. The server shutdown trap has a Generic Type of 6 (that is, an enterprise-specific type) and Specific Type of 70 (that is, server shutdown). We are now ready to explore the other trap types that WebLogic SNMP supports.
WebLogic SNMP supports defining three types of traps. The first type of trap is an attribute change trap. With this trap, the WebLogic SNMP agent generates a trap whenever a configuration value changes. These traps work directly on the JMX MBeans. To define an attribute change trap, select the Services- > SNMP- > Traps- > Attribute Changes folder in the left-hand navigation bar and specify the trap s Name , Attribute MBean Type , Attribute MBean Name , and Attribute Name . You must create the new trap before you can select the servers to which the trap applies. Create a trap to notify you if someone changes the Targets attribute of the BigRezPool using the values shown in Table 11.9. Once you define the trap and restart the admin server, try changing the targets for the BigRezPool to exclude Server3 . Notice that Server3 is not included in the Enabled Servers list, but you still get the trap because the JDBCConnectionPool MBean is a configuration MBean and all configuration is controlled by the admin server.
| Name | Value |
|---|---|
| Name | BigRezPool Targets Attribute Trap |
| Attribute MBean Type | JDBCConnectionPool |
| Attribute MBean Name | BigRezPool |
| Enabled Servers | AdminServer |
A log filter trap generates a trap whenever an entry appears in the WebLogic Server log file matching the filter. Log filters can specify several different parameters by which to filter log messages that should generate a trap. Let s examine a WebLogic Server log file entry.
####<Apr 13, 2003 11:22:41 AM CDT> <Info> <JDBC> <machine1> <Server1> <ExecuteThread:
EAN: 2147483647
Pages: 125