Chapter 11: Administering and Deploying Applications in WebLogic Server
In this chapter, we will discuss the finer points of WebLogic Server administration. If you are unfamiliar with WebLogic Server administration, you should consult the WebLogic Server documentation at http://edocs.bea.com/wls/docs81/admin.html for more information. We begin by reviewing the key WebLogic Server architectural concepts. The purpose of this discussion is to give you a big-picture understanding of how the WebLogic Server product works. Next , we discuss WebLogic Server administration concepts. Finally, we end the chapter by discussing WebLogic Server configuration, management, and monitoring.
WebLogic Architecture Key Concepts
In this section, we will review some of the key concepts associated with the WebLogic Server deployment architecture. Before jumping into the details, we need to define a few terms that will be used throughout the rest of this chapter. In this chapter, the terms server and instance are used to describe a Java Virtual Machine process that is running the WebLogic Server software program. We will use the term machine to describe a computer with its own CPU, memory, and secondary storage that is running its own copy of the operating system software. Even though it is often possible to partition large computers into several logical, smaller computers, we will not make a distinction between multiple machines that, through logical partitioning, are part of the same chassis and those that are not. Now, we are ready to review the WebLogic Server deployment architecture.
Domain Architecture
A WebLogic Server instance is the process responsible for receiving incoming requests from the user , dispatching those requests to the appropriate J2EE application component(s), and returning responses to the user. This server instance provides the J2EE containers necessary to deploy any J2EE-based application and handles all of the resource management for the application. We will talk more about the internal architecture of the server in the next section.
A WebLogic Server cluster is a loosely coupled grouping of WebLogic Server instances that provide a cluster-wide naming service, load distribution, and some fault tolerance to hosted application(s). WebLogic Server dynamically determines the membership of the cluster using heartbeat messages that are periodically sent via IP multicast. Through these multicast messages, each cluster member maintains its own cluster membership list. In a similar fashion, every server in the cluster maintains a complete copy of the cluster-wide JNDI namespace. WebLogic Server uses a reliable IP multicast-based protocol to propagate all changes to the JNDI namespace on any particular server to the other cluster members . This loosely coupled clustering architecture allows each server to function independently of any other WebLogic Server process.
Using the ability to define a machine in your WebLogic Server domain, you can tell WebLogic Server which servers run on which machines. The in-memory replication feature of WebLogic Server clustering uses this knowledge to locate the secondary copy of a particular object so that the primary and secondary copies of an object reside on different machines, whenever possible. The administration server also relies on this machine configuration information to determine how to contact a particular WebLogic Server instance s node manager. We will talk more about clustering, in-memory replication, and the node manager later.
A WebLogic Server domain is an administrative grouping of servers and/or clusters. You configure, manage, and monitor the domain from a central location; this central location is the administration (or admin , for short) server . The admin server is just a WebLogic Server instance that runs some special administrative applications. Through these applications, the admin server maintains a repository of configuration information for the domain, acts as a centralized application deployment server, and provides a browser-based administrative console application that the administrator uses to configure, manage, and monitor all aspects of the domain. A managed server is the term for any other server in the domain other than the admin server. On startup, a managed server contacts the admin server to obtain its configuration information and applications to deploy. WebLogic Server optimizes this transfer of information to include only information that has changed since the managed server was shut down. Once the managed server is running, it no longer depends on the admin server to be able to process client requests. As you will see later in this chapter, the admin server introduces a centralized location for configuration, management, and monitoring but does not significantly compromise the benefits of the loosely coupled cluster architecture.
The node manager is an optional daemon process that runs on each machine where managed servers may be run. WebLogic Server 6.1 uses the node manager only to allow administrators to start servers on remote machines from the WebLogic Console. As we shall discuss later, the node manager s role now includes server monitoring and automatic restart capabilities.
Figure 11.1 shows how all the pieces fit together. In this example, we have the admin server for the mydomain domain running on machine m1 . This admin server manages the configuration information for two different clusters, abc and mycluster , and one stand-alone server, X . Each machine has a node manager running on it; the configuration information would also specify which servers are running on each machine.
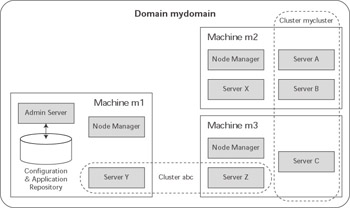
Figure 11.1: WebLogic Server domain architecture.
WebLogic Server Architecture
A high-level understanding of the server s internal architecture is important to understanding how to design, build, deploy, and debug applications that will run on WebLogic Server. While many things have changed since the early versions of Tengah (the name of the server before the BEA acquisition), the fundamental message processing architecture remains relatively unchanged. As shown in Figure 11.2, the core components of the server are the listen threads , the socket muxer , and the execute queue with its associated execute threads . When the server process starts up, it binds to one or more ports and assigns a thread to each port to listen for connection requests. Once the server accepts the connection request and establishes the connection, the server hands off control of the connection to the socket muxer, which waits for incoming requests. At a high level, the socket muxer detects an incoming request, reads the request off of the socket, and places the request along with any associated security or transaction context onto the appropriate execute queue (typically, the default execute queue). Once a request appears on the execute queue, an idle execute thread takes the request off of the queue, assumes the identity of the user who submitted the request, executes the request, returns the response to the caller, and goes back to wait for the next request.
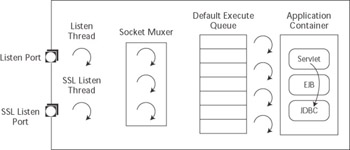
Figure 11.2: WebLogic Server internal architecture.
Execute Queues and Execute Threads
Once an execute thread invokes the target component of the request, that execute thread will, under most circumstances, process the entire request. Figure 11.2 depicts this fact by showing a single execute thread spanning the servlet, EJB, and JDBC components in the application container. The call to the servlet, its call to a method on an EJB, and the EJB s use of JDBC to query a database will all occur within the same execute thread. During the execution of a request, the execute thread will be unavailable to process any other requests until the request processing code completes successfully or throws an exception. This is an extremely important point to recognize.
If the application code blocks the execute thread for an extended period of time, the server will not be able to use that thread to process other requests coming into the execute queue. While WebLogic Server does some basic sanity checks during the execution of any request (for example, checking the transaction time-out before dispatching an EJB method invocation), it is generally not possible for the server to tell the execute thread to abort the processing of a request. If the application gets into a state where every execute thread is blocked for an extended period of time, the server will become nonresponsive (for requests targeted to that execute queue). Although the listen threads and the socket muxer are able to accept new requests from clients and place them into the execute queue, no execute threads will be available to process the request and return the response to the client.
When these long-running requests cause the execute threads to block, the incoming requests will start to back up in the execute queue. Even if the condition causing the execute threads to block goes away, it is very likely that the execute queue will end up with a relatively large number of messages. This not only will cause degradations in response time but also may cause users to cancel their requests (by pressing the stop button on their browsers) and to resubmit them. Typically, this will only make the situation worse because WebLogic Server currently processes every message on the execute queue in first-in-first-out order. In certain conditions (for example, reading HTTP POST data associated with a Web application request), WebLogic Server will detect that the client is no longer waiting on the response and will short-circuit the request processing. Other conditions, though, may cause WebLogic Server to process the request even if the client is no longer waiting for the response.
In WebLogic Server 7.0, BEA introduced the ability to grow the number of execute threads associated with an execute queue. Several configuration parameters control this growth. To view a server s execute queue configuration parameters using the WebLogic Console, right-click on the server in the left-hand navigation bar and select the View Execute Queues menu item. On the resulting screen, select the link for the execute queue of interest (such as weblogic.kernel.Default , which is the new name of the default queue) to display the execute queue s Configuration tab. Let s talk briefly about the meaning of some of these configuration parameters. For more information on how to optimize the execute queue configuration, please refer to Chapter 12.
| Best Practice | Always do proper capacity planning and server tuning to choose the optimal number of execute threads. Avoid using the server s ability to grow the number of execute threads to handle normal peaks in application load. |
The Queue Length parameter controls the maximum number of requests that the execute queue can hold. If the execute queue fills up, WebLogic Server will reject any requests bound for that queue until space becomes available. Whenever the server rejects a request, it writes error messages to the log file indicating that the execute queue is full. The Thread Count determines the number of execute threads that the server creates at startup. If the number of requests on a queue reaches the Queue Length Threshold Percent of the Queue Length , the server will create additional execute threads equal to the number in the Threads Increase setting to try to alleviate the queue backup. If, at some point after this initial allocation of more execute threads, the queue length drops below the Queue Length Threshold Percent full and later reaches the threshold again, the server again tries to spawn more threads. The server will continue to operate in this fashion up until it reaches the maximum number of threads, as specified by the Threads Maximum parameter. If the queue length never drops below the threshold, the server will not allocate any more execute threads even if the current number of threads is less than the Threads Maximum limit. Currently, WebLogic Server never tries to shrink the number of threads in the execute queue.
| Best Practice | Do not allow the execute queue to get so long that the response time for new requests would be longer than most clients are willing to wait. Spawning new threads to try to catch up when most requests coming into the execute queue will never have their responses returned to the client will help only if you have enough excess CPU capacity to take advantage of the extra threads. |
WebLogic Server checks for stuck threads. Stuck threads are threads that have been processing a particular request for more than the Stuck Thread Max Time . The server checks for stuck threads periodically; the Stuck Thread Timer Interval parameter controls the frequency of this check. If the server determines that all of the execute threads for a particular queue are stuck, it will allocate more threads (according to the Threads Increase parameter), log an emergency message that this has happened , and set the health state of the server to a critical level (we will talk more about server health checks and states later). In a similar fashion to the queue length threshold percent protection mechanism, the server will continue to increase the number of threads if the problem continues to propagate to the newly created threads until it reaches the Threads Maximum limit.
In WebLogic Server 7.0, these parameters are tunable through the server s Tuning Configuration tab. At the time of writing, these parameters are not surfaced in the WebLogic Server 8.1 Console. We expect that this may change by the time you read this so please consult the WebLogic Server documentation at http://edocs.bea.com/ wls/docs81/perform/WLSTuning.html for more information .
| Best Practice | Do not set the Stuck Thread Max Time and Stuck Thread Time Interval too low so that normal requests during peak processing times will be mistaken for stuck threads. Be sure, though, to set them low enough to allow the server to take corrective action before it is too late. For many applications, values on the order of 60 to 120 seconds will be sufficient. |
WebLogic Server provides the ability to create user-defined execute queues. Through this mechanism, you can limit the resources a server is using to process different types of requests. Because each execute queue has its own configurable pool of execute threads, you can limit the number of threads concurrently processing requests associated with the particular execute queue. At the same time, you can also guarantee that a certain number of threads will always be available to process the requests for a given execute queue. To some extent, this allows certain types of requests to have priority by keeping those requests from going to the default execute queue and waiting behind every other request for processing.
The ability to define new execute queues also helps to eliminate certain deadlock situations. For example, if all of the execute threads in one server are blocked waiting on responses from another server while the other server s execute threads are all blocked waiting on responses from the first server, a cross-server deadlock situation can occur. Configuring a separate execute queue for these server-to-server requests prevents the deadlock. We will discuss this in detail in the WebLogic Server Clustering Architecture section.
| Best Practice | Create user-defined execute queues to partition application components and provide a dedicated amount of resources to a particular component or to eliminate potential cross-server deadlock situations. |
Defining a new execute queue is easy. Use the View Execute Queues menu item on the server s pop-up menu and select the link entitled Configure a new Execute Queue .
Once you have created the new execute queue, you need to configure the dispatch policy for your application s J2EE components to map them to the new queue. It is important to understand that the selection of an execute queue happens in the socket muxer. This means that once an execute thread begins executing a request, a call to another component will always take place on the same execute thread, regardless of the target component s dispatch policy.
To configure a servlet or JSP to use a user-defined execute queue, use the wl- dispatch-policy initialization parameter to specify the name of the execute queue in the Web application s web.xml deployment descriptor:
<servlet> <servlet-name>HighPriorityServlet</servlet-name> <jsp-file>high_priority.jsp</jsp-file> < init-param > < param-name > wl-dispatch-policy < /param-name > < param-value > MyPriorityQueue < /param-value > < /init-param > </servlet>
To map the entire Web application to a user-defined execute queue, use the wl-dispatch-policy element in the weblogic.xml deployment descriptor:
<weblogic-web-app> ... < wl-dispatch-policy > MyPriorityQueue < /wl-dispatch-policy > ... </weblogic-web-app>
To map an EJB to a user-defined execute queue, use the dispatch-policy element in the weblogic-ejb-jar.xml file:
<weblogic-enterprise-bean> <ejb-name>HighPrioritySessionEJB<ejb-name> ... < dispatch-policy > MyPriorityQueue < /dispatch-policy > </weblogic-enterprise-bean>
In addition to partitioning requests using separate execute queues, you can augment these prioritization capabilities by setting the priorities of an execute queue s threads. By reducing the thread priority for a particular execute queue, you can give a lower priority to this queue s requests and help ensure that requests bound for other queues get preferential treatment by the JVM/OS thread scheduler. Conversely, increasing the thread priority can help ensure that the server will process an execute queue s requests before requests in other queues with lower thread priorities. This is useful for processing time-critical requests. You must be careful, however, when adjusting thread priorities. Lowering an execute queue s thread priority below the default value of 5 may affect the server s ability to keep up with requests coming into this queue and could ultimately cause the queue to overflow. Raising the thread priority too high not only can prevent the server from being able to keep up with requests being targeted to other execute queues but also can impact the ability of the server to manage its resources effectively and respond to administrative control. Another point to keep in mind is that if a lower-priority thread yields to a higher priority thread while holding a shared (and exclusive) resource, the high-priority thread will end up waiting for the lower-priority thread to release the resource. This condition, known as priority inversion , can cause thread priority settings to be ineffective . Careful consideration, capacity planning, and rigorous load testing should always accompany any plans to change execute thread priorities.
We strongly discourage changing the priorities of any of WebLogic Server s built-in execute queues, including the default execute queue. Typically, it is best to avoid using priorities unless load testing of the application demonstrates the need to do so. Even then, we recommend adjusting thread priorities only for execute queues that expect a small volume of messages, and only adjusting the priority of a single queue either up or down (or in the worse case, one of each). Adjust the thread priority up or down by only one or two. Never use a value of 9 or 10 because WebLogic Server uses these levels to keep high-priority tasks running behind the scenes.
| Warning | Think twice before changing the thread priority of execute threads for any execute queue because this can affect the server s ability to process requests in a timely manner. Priority inversion can occur if components running in threads with different priorities depend on exclusive access to a shared resource. Always load test the application for an extended period of time after making any thread priority adjustments to make sure that the server s ability to process requests has not been compromised. |
Socket Muxer
The socket muxer manages the server s existing socket connections. The first thing it does is determine which sockets have incoming requests waiting to be processed . Then, it reads just enough of the data to determine the protocol, packages the socket up into a protocol-specific data structure, and dispatches the socket to the appropriate run-time layer. In this run-time layer, the socket muxer thread reads the entire request off the socket, sets up any required context information, determines which execute queue to use, and places the request onto the execute queue.
WebLogic Server has two versions of the socket muxer, an all-Java version that currently has to poll each socket to determine whether a request is waiting and a version that uses a small native library leveraging the more efficient operating system call to make that determination. The Enable Native IO checkbox on the server s Tuning Configuration tab tells the server which version to use; this is on by default on most platforms. It is important to remember that in order to use native I/O, you must make sure that the native library is in the server s shared library path . The default scripts that come with the server set this up for you. If the server fails to load the native library, it will throw a java.lang.UnsatisfiedLinkException and then load the all-Java version, so you need to pay close attention to the server output and log file to make sure that you are, in fact, using the native version.
With a small number of concurrent connections, the all-Java version tends to be faster; this is probably due to the huge overhead associated with making JNI method calls compared to making Java method calls. As the number of concurrent socket connections grows, however, the native I/O muxer quickly becomes more efficient. We recommend using the native I/O muxer in most production environments if it is available on the target platform.
| Best Practice | Always enable native I/O, if available, and check for errors at startup to make sure it is being initialized properly. |
WebLogic Server 8.1 also has a new socket muxer based on the non-blocking I/O (NIO) capabilities of the Java 2 SDK 1.4. This new muxer will eventually replace the native muxer because the operating system calls used by the native muxer are now being surfaced in Java. At the time of writing, the new NIO muxer is not officially supported by BEA and does not support SSL. We expect both of these to change, so check the WebLogic Server documentation for more information. To enable the NIO muxer, set the Java system property weblogic.MuxerClass to weblogic.socket.NIO SocketMuxer on the Java command line. One advantage of the NIO muxer is that it also works on the WebLogic Server client run time, unlike the native I/O muxer. Remember, however, never to use an unsupported feature in a production environment.
The Java socket muxer steals threads from the default execute queue s thread pool. The Socket Readers parameter controls the maximum number of threads the Java socket muxer can steal as a percentage of the total number in the queue. By default, the Socket Readers parameter is set to 33, meaning that the Socket Muxer can take up to 33 percent of the total number of execute threads from the default execute queue. For example, if the default execute queue has 15 threads, we may have only 10 threads processing requests and 5 threads reading incoming requests off the sockets. The Socket Readers parameter is also configurable using the server s Tuning Configuration tab.
In previous versions of WebLogic Server, the native I/O version of the socket muxer used a fixed number of threads from the default execute queue s thread pool. On Windows, it used two times the number of CPUs; on Unix platforms, it always used three threads. Starting in WebLogic Server 8.1, the native I/O and NIO muxers use their own execute thread pool (associated with the weblogic.socket.Muxer queue) and now use n + 1 threads by default, where n is the number of CPUs.
It is possible to increase the number of socket muxer threads. For the all-Java version, increase the Socket Readers parameter or increase the number of execute threads associated with the default execute queue. WebLogic Server uses Java system properties to control the number of threads used by the native I/O version. WebLogic Server 8.1 uses the weblogic.SocketReaders Java system property to control the number of socket reader threads for both the native I/O and NIO muxers. Previous versions of the server used the weblogic.NTSocketReaders and weblogic.PosixSocketReaders Java system properties to control the number of socket reader threads stolen from the default execute queue on Windows and Unix, respectively. In our experience, the only reason we have ever changed the number of socket reader threads was to allow Java application clients to be more responsive when talking to a large cluster of servers, and even then, the change was made only on the Java application client and not on the server. Recent changes in the client run time have made even this unnecessary.
Listen Ports and Listen Threads
By default, WebLogic Server starts up listening on two ports. The plain-text listen port accepts connections for HTTP, T3, IIOP, COM, and LDAP protocols. The SSL listen port accepts connections for HTTPS, T3S, and IIOPS protocols. Each port has a listen thread associated with it. This thread simply waits for connection requests, accepts the connection, hands the connection off to the socket muxer, and goes back to listen for the next connection request.
WebLogic Server also has the concept of an administration ( admin , for short) port , allowing administration requests to the server to be directed to a separate port and associated listen thread. When using the admin port, WebLogic Server will reject all administrative requests that arrive at any listen port other than the admin port. Use of the admin port also requires all administrative requests to use SSL.
In addition to the default network configuration (also known as the default channel ) described already, WebLogic Server gives the administrator more flexibility and control over the server s network configuration. While the server still requires at least one enabled port on this default channel, it gives us the ability to turn off the default channel s plain-text listen port, something that was impossible in previous versions. We will talk more about these more advanced network configuration capabilities in the Network Channels section.
Application Container
The application container is simply the mechanism in which the server deploys applications. WebLogic Server requires that all application components be packaged as some type of J2EE application component. This packaging has multiple benefits that we discuss in other portions of this book, but the main implication that affects administration is the ability to perform what is known as hot deployment . Using hot deployment, we can deploy, redeploy, or undeploy an application while the server is running without affecting other applications or requiring a server restart.
To support unloading an application and achieving hot deployment, WebLogic Server relies on Java s ability to define custom classloaders. The reason for using custom classloaders is simple: Java does not provide any mechanism to unload or reload classes loaded by its default classloader, known in the WebLogic Server documentation as the system classloader (the one that uses the CLASSPATH environment variable for its search path). The system classloader simply loads the class from disk the first time it encounters a need for that class and then never looks at the class file on disk again. This means that once the system classloader loads a class, it will never pick up any changes to that class. Restarting the JVM is the only way to reload a class with the system classloader. Fortunately, Java does provide the ability to define and use custom classloaders. WebLogic Server deploys J2EE applications using custom classloaders so that you can unload or reload an application without restarting the server. See the discussion in Chapter 8 or the WebLogic Server documentation at http://edocs.bea.com/wls/docs81/programming/ classloading .html for more information.
In this section, we have discussed the primary architectural features of WebLogic Server. A thorough understanding of these features will go a long way toward helping application architects , developers, and administrators make good decisions about application design, development, debugging, configuration, management, and monitoring. Many problems with WebLogic Server applications can be explained in terms of the concepts discussed in this section, so always keep these concepts in mind when looking for the root cause of a problem. We ll now take an in-depth look at the WebLogic Server clustering architecture.
WebLogic Server Clustering Architecture
WebLogic Server clustering provides load balancing and failover capabilities to J2EE-based applications. Through its clustering mechanisms, WebLogic Server loosely couples together a set of server processes, distributed across one or more machines, so that they can share the responsibilities of processing requests for the applications deployed to the cluster. Exactly what facilities WebLogic Server clustering provides to an application depends on whether the application is Web-based or RMI-based. Before we get into the details of the application-level facilities provided, let s look under the hood to see how WebLogic Server clustering works.
As previously mentioned, WebLogic Server clustering provides a loose coupling of the servers in the cluster. Each server in the cluster is independent and does not rely on any other server for any fundamental operations. Even if contact with every other server is lost, each server will continue to run and be able to process the requests it receives. Each server in the cluster maintains its own list of other servers in the cluster through periodic heartbeat messages. Every 10 seconds, each server sends a heartbeat message to the other servers in the cluster to let them know it is still alive . Heartbeat messages are sent using IP multicast technology built into the JVM, making this mechanism efficient and scalable as the number of servers in the cluster gets large. Each server receives these heartbeat messages from other servers and uses them to maintain its current cluster membership list. If a server misses receiving three heartbeat messages in a row from any other server, it takes that server out of its membership list until it receives another heartbeat message from that server. This heartbeat technology allows servers to be dynamically added and dropped from the cluster with no impact on the existing servers configurations.
WebLogic Server also provides a cluster-wide JNDI namespace. Again, each server maintains its own view of the cluster-wide JNDI namespace, and any changes to the cluster-wide JNDI namespace on one server are propagated to the other servers via a reliable IP multicast-based protocol. This allows applications to have a global view of the cluster-wide JNDI namespace from any server in the cluster. Recognize that this JNDI replication is designed for service advertisement across the cluster, and not for replicating or sharing non-RMI-based objects across the cluster. Any object bound into the cluster-wide JNDI tree is always associated with the server that did the binding. If that server goes down, all JNDI references to the object will be removed from every server in the cluster. Of course, this is what you want for RMI-based references, but probably not what you would expect or want for cluster-wide sharing of objects.
Clustering for Web Applications
For Web applications, WebLogic Server clustering provides persistence mechanisms for HttpSession objects. Through these persistence mechanisms, Web applications that make use of HttpSession objects to store temporary state information can transparently fail over when a server in the cluster fails. Configuring the persistence mechanisms involves making changes to the Web application s weblogic.xml deployment descriptor.
The most popular form of session persistence is in-memory replication. WebLogic Server uses a primary-secondary replication scheme in this form of persistence. The primary copy of the HttpSession object will be created by whichever server happens to be processing the user s first request requiring access to the HttpSession . At the end of that request, and before the response is returned to the user, the server will create a secondary copy of the HttpSession on another server in the cluster, encode the location of the primary and secondary copies of the HttpSession in the session ID, and add a cookie that contains the session ID to the response (the server can use URL rewriting if cookies are disabled). Typically, the primary server for a particular session will receive all future requests for that session. If the primary server fails, the first request following the failure will be routed to another server in the cluster. When the server receives a request for which it is not the primary, it will become the new primary server and make sure that another server in the cluster is holding the secondary.
Three burning questions may occur to you at this point:
-
How is the routing accomplished?
-
How does WebLogic Server determine where to place the secondary copy of a session?
-
How does WebLogic Server detect changes to the primary copy and transmit them to the secondary?
Session-Based Routing
WebLogic supports two different mechanisms for accomplishing the routing of HTTP requests. The first routing mechanism uses a Web server plug-in to proxy requests from a Web server to the WebLogic Server cluster. While Chapter 14 discusses deployment models in more detail, Figure 11.3 shows a common deployment model for this architecture. Web server plug-ins are available for Netscape/iPlanet, Microsoft IIS, and Apache Web servers and for WebLogic Server itself.
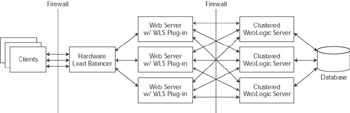
Figure 11.3: Web server proxy-based deployment model.
When the plug-in receives a request from the Web server, the plug-in looks for a session ID associated with the request. If a request does not contain a session ID, the plug-in uses a round- robin load-balancing algorithm to determine the server to which the request should be sent. When a request does contain a session ID, the plug-in uses information encoded in the session ID to determine the location of both the primary and secondary copies of the particular session. Whenever possible, the plug-in will route the request to the server that contains the primary copy of the session. If the server holding the primary copy is down, the plug-in tries to send the request to the server holding the secondary copy. When the server with the secondary copy receives the request, it will promote the secondary copy to the primary copy, create a new secondary copy, create a new session ID, and return the new session ID along with the response.
If both the primary and secondary servers are down (or have been restarted), the plug-in will treat the request as if it did not contain a session ID and route it to any server in the cluster that is available. This is an inherent feature of the in-memory replication model and is not a shortcoming of the plug-in. WebLogic Server replicates only session data as the result of a request for that session. Given that WebLogic Server does not attempt to keep cluster-wide session-to-server mapping information (presumably for performance and scalability reasons), the only way to locate a session is by the information contained in the session ID that is passed back to the browser.
The plug-in also supports transparent retry logic so that if it fails to deliver a request successfully to a WebLogic Server instance, it can resend the request to a different server in the cluster. If the plug-in determines that the server never received the request, it will always try to resend the request to another server in the cluster. In cases where the plug-in successfully sent the request to the server, but never received a response, you can configure the plug-in either to retry the request (the default) or to return an error to the caller. The two plug-in configuration parameters that control this behavior are Idempotent and HungServerRecoverSecs .
If the Idempotent parameter is set to true (which is the default value), the plug-in will retry any request for which it does not receive a response within the HungServerRecoverSecs time-out interval. The default time-out value is 300 seconds; the accepted range of values is 10 to 600 seconds. When using the Idempotent feature, applications must be able to handle duplicate requests properly because the server may have already processed the message (or may process the message later if the server s execute queue is backed up). For applications that are unable to handle duplicate requests, set the Idempotent parameter to false . For the Netscape/iPlanet and Apache Web servers, these parameters can be set differently for different URLs and MIME types.
The second routing mechanism uses a hardware load balancer that routes directly to the cluster. Figure 11.4 shows a common deployment model for this architecture. Because the hardware load balancers generally do not understand the contents of the WebLogic Server session ID, WebLogic Server had to introduce a mechanism by which requests not directed to the server holding the primary copy of the session can be promoted to the primary. When a server receives a request with a session ID for which it does not hold the primary copy of the session, it will look at the location information in the session ID to determine the location of the session copies. If both the primary and secondary servers still exist, the server will call out to the primary server to tell it to send back a copy of the session and to give up its rights as the primary for this session. If only the secondary exists, the server will call out to the secondary server to tell it to send back a copy of the session, and it will then become the new primary for this session. While this mechanism is general enough to work with all hardware load- balancing schemes, the overhead of copying the session between servers will dramatically compromise both the performance and the scalability of the cluster. Fortunately, most hardware load balancers on the market today support one or more sticky load-balancing algorithms.
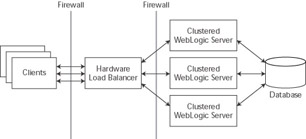
Figure 11.4: Proxy-less deployment model.
Using a sticky load-balancing algorithm, the load balancer remembers where it sent the last request for the particular user s session and always tries to route all subsequent requests from that session to the same server. The only time the load balancer will route the request to a different server is in the event of a failure of the primary server. When this happens, the load balancer will remember the new location and route all subsequent requests there until another failure happens. Clearly this mechanism is highly desirable because it will prevent moving the session between servers except when the primary server fails. In fact, this proxy-less deployment model using a hardware load balancer and a good sticky load-balancing algorithm has several advantages over the Web server proxy-based model. We will discuss this deployment model and its advantages and disadvantages in more detail in Chapter 14.
Secondary Selection
WebLogic Server uses two mechanisms to help select the secondary server for in- memory replication: machine definition and replication group definition. If we choose not to use either of these mechanisms, WebLogic Server uses a simple ring algorithm to select the secondary server (for example, server 1 has primaries that are replicated to server 2, server 2 has primaries that are replicated to server 3, and server 3 has primaries that are replicated to server 1). This works fine as long as all server instances are running on separate hardware and there are no special circumstances that require more deterministic selection.
By defining machines and assigning server instances to machines, you can tell WebLogic Server which server instances live on which machines. If the machine information is available, the secondary selection algorithm will use this information to ensure that the primary and secondary copies are on two different machines, if possible. In addition, you can use replication groups to gain even more control over the secondary selection process. By grouping servers into replication groups, you can tell WebLogic Server that a particular replication group should use another replication group as its preferred secondary replication group. If replication groups are in use, the secondary selection algorithm changes to the following sequence:
-
Is there a server in the preferred secondary replication group that is located on another machine?
-
Is there a server in the preferred secondary replication group that is located on the same machine?
-
Is there a server in any other replication group that is located on another machine?
-
Is there a server in any other replication group that is located on the same machine?
While specifying machines and replication groups is completely optional, we recommend specifying the machine information in all environments given the fact that some of the node manager configuration information is set at the machine level. Replication groups, on the other hand, are something that you should use only if you have a specific purpose in mind because, by default, WebLogic Server will make every effort to replicate objects across machines even without the use of replication groups.
| Best Practice | Always specify the machine information for servers in a cluster when using in-memory replication. Define replication groups only if you need more control over the secondary selection process. |
Change Detection and Propagation
The server detects changes to the HttpSession objects by trapping all calls to the methods used to modify the objects bound into the session. WebLogic Server simply sets hooks in the setAttribute() and removeAttribute() methods to detect attribute modification during the course of processing a request. At the end of the request processing, but before returning the response to the user, the server will synchronously update the secondary copy of the session (or the persistence store) by propagating only the changes. This implementation has a couple of implications.
First, objects that already exist in the session from a previous request will need to be rebound into the session if we make changes to them during the current request processing. This is somewhat unnatural to most Java programmers. When writing a servlet or JSP to access a previously created object stored in the session, the Http Session.getAttribute() method returns a reference to the existing object. Because the session obviously already has a reference to the object, it seems like an unnecessary step to reset the attribute with the same object s reference, but it is critical because this is how WebLogic Server identifies the modified attributes. We feel that the trade-off of having to invoke setAttribute() explicitly every time you modify an existing object is better than the alternative. Without the signal provided by set Attribute() , the server would incur more overhead during session persistence, perhaps by copying the entire object every time or using before and after images to determine what, if anything, has changed in the session.
| Warning | WebLogic Server will persist the changes to the HttpSession object only when using session persistence. The server detects changes to the HttpSession objects by trapping calls to the setAttribute() and removeAttribute() methods. This means that any objects previously bound into the session before the beginning of the current request must be rebound into the session by calling setAttribute() if they are modified. Failure to do so will result in changes not being persisted . |
Second, the server propagates changes to objects bound into HttpSession at the HttpSession attribute level. This means that the server propagates any change to an attribute by serializing the entire object associated with the attribute and sending it to the secondary server (or the persistent store), regardless of the magnitude of the change to the object (or even if there is no change at all) whenever you call the set Attribute() method for that object. This means that the size and granularity of the objects bound into the HttpSession will directly affect performance and scalability. We will revisit this discussion in Chapter 12.
Clustering for RMI-Based Applications
In RMI-based applications (which include EJB applications), the client uses a stub to invoke a method on the remote, server-side object. In standard, non-clustered RMI, this stub contains a single reference to the server process where the server-side object resides. WebLogic Server clustering introduces the concept of a replica-aware stub (also referred to as a cluster-aware stub ) ”a stub that contains references to all servers in the cluster that have a replica of the particular object. The stub load- balances method invocations on the stub by distributing the requests across servers in the cluster based on the load-balancing algorithm in use. By default, WebLogic Server uses a round-robin algorithm, but it also supports a couple of other load-balancing algorithms as well as an extensible mechanism, known as call router objects, whereby programmers can supply their own load-balancing logic. Unfortunately, the current interface for this extensible load-balancing mechanism does not provide access to the dynamic cluster list contained in the stub. This makes the mechanism of limited value because without this, there is no dynamic way for the call router object to know which servers are in the cluster and supporting replicas of the target object ”at least, not without having the call router make calls to the Java Management Extensions (JMX) APIs in the server to determine this information.
| Best Practice | Use one of the built-in load-balancing algorithms rather than trying to use call routers due to their limitation of not having access to the dynamic cluster list maintained by the stubs. |
It is important to note that the load-balancing state is per stub instance. What this means is that each time the caller gets a new stub (for example, via a JNDI lookup, calling a Home interface method on an EJB home object, etc.), the first invocation on the stub will randomly pick a server in the list to use to process the first request. All subsequent requests on that same stub will apply the chosen load-balancing algorithm. For example, if the stub s replica list has servers s1 , s2 , and s3 in it and you are using the default load-balancing algorithm, if the first request is sent to s2 , the next requests will go to s3 , s1 , s2 , and so on. If, however, the client gets a new stub for every request, the load distribution will be somewhat random based on the fact that each stub instance selects a random starting point in the list to begin applying its algorithm. Keep this point in mind when trying any tests of WebLogic Server clustering to observe the load-balancing behavior.
If a server fails, the stub provides retry logic under certain conditions. Much like the previous discussion concerning the proxy plug-in, the stub will always retry requests that it knows never reached the server. The stub, though, will not try to resend failed requests that may have reached the server unless specifically told to do so. One important thing to remember is that if the stub and the target are collocated, no load balancing will be done because it is almost always more efficient to invoke the local replica of the object than it is to call out to another replica on another server.
RMI programmers have a great deal of control and flexibility when configuring the replica-aware stub behavior. For example, the “methodsAreIdempotent switch to WebLogic s RMI compiler ( weblogic.rmic ) allows the programmer to tell the stub that the object s methods have been written in such a way that it is safe to retry failed requests whose state is unknown. While this particular option is also surfaced in the deployment descriptor for stateless session beans, the RMI compiler has other options available. Fortunately, most of the important options are available to EJB programmers, and in many cases, the WebLogic Server default settings are often good enough for configuring EJB clustering. Because most J2EE developers are using the EJB programming model instead of the lower-level RMI programming model, we will spend the rest of our time talking specifically about EJB clustering.
WebLogic Server provides a very robust clustering model for EJBs. By default, all EJB home objects, stateless session beans, and entity beans use cluster-aware stubs when they are running in a clustered environment. This means that even if your programmers are not developing in a clustered environment, their deployed beans will generally become cluster-aware once they are put into a cluster. Stateful session beans can also use in-memory replication, much like that previously described for HttpSession objects. The load-balancing and failover behavior of the stubs varies depending on the types of objects in question.
All EJB home objects and stateless session beans use load-balancing stubs by default. Whether the stubs should be cluster-aware and what load-balancing algorithm they should use are configurable on a per-bean basis in the weblogic-ejb-jar.xml deployment descriptor. EJB home stubs for stateless session beans are always set to use idempotent behavior; all other types of EJB home stubs are not. By default, stateless session beans are not set to be idempotent, but they can be configured to use idempotent behavior by setting a flag in the deployment descriptor. All EJB methods (home and remote interface methods) can be configured to be idempotent using the idempotent-methods element in the weblogic-ejb-jar.xml deployment descriptor:
<weblogic-ejb-jar> ... <idempotent-methods> <method> <ejb-name>TellerEJB</ejb-name> <method-intf>Remote</method-intf> <method-name>checkBalance</method-name> <method-params> <method-param>java.lang.String</method-param> </method-params> </method> </idempotent-methods> ... </weblogic-ejb-jar>
By default, stateful session bean instances exist only on the server on which they were created. They can be configured to use in-memory replication, just like the HttpSession object, using the weblogic-ejb-jar.xml deployment descriptor, a topic discussed in Chapter 6. If a stateful session bean is using replication, the stub will be aware of both the primary and secondary copy of the bean but will always route the calls to the primary copy of the bean except in the case of failure. Unlike HttpSession replication, stateful session beans do not require (or support) a routing layer because the stub handles all the routing. Therefore, stateful session bean replication does not use the machinery that redirects a misdirected request in the case of the HttpSession object requests. The change detection mechanism for stateful session beans uses a serialized before and after image to determine the changes that need to be sent to the secondary at the end of the transaction (or method call for non-transactional invocations) because there are no methods by which the server can detect changes to the bean s internal state.
By default, entity beans use stubs that are cluster-aware; however, entity bean stubs use a sticky routing algorithm to route requests to the cluster. The primary reasons for doing this are to improve the caching capabilities of the server and to reduce transaction propagation across servers in the cluster to improve performance.
In this section, we discussed the details of the WebLogic clustering architecture and the application facilities it provides. A thorough understanding of the architecture will help application programmers make good decisions on application design to maximize the benefits of clustering. Administrators should also understand the architecture and its implications when determining production deployment configurations. The next section talks about the admin server and its critical role for the application administrator.
Admin Server
WebLogic Server uses the admin server to configure, manage, and monitor the servers in a domain. The admin server is simply a WebLogic Server with two internally deployed applications that provide administrative capabilities for the entire domain ( wl_management_internal2.war and console.war ). All servers internally deploy an administrative application ( wl_management_internal1.war ) that allows the admin server to send administrative information to them.
The admin server maintains an XML repository of configuration information in the config.xml file. This file contains information about every server, every cluster, every application, and every service deployed in the domain. Although you can edit the config.xml file by hand, we strongly recommend that you use the WebLogic Console to change configuration information.
The typical application deployment model also uses the admin server as the application repository. Under this model, you only need to place the J2EE application package(s) physically on the admin server. You can use the WebLogic Server administration tools to deploy the applications to any server or cluster in the domain. At startup, the managed servers contact the admin server to determine their configuration and download any changes that may exist. In addition, you can deploy applications to a managed server that is already running because the admin server will push the applications out to the managed server and deploy it into the server.
One word of caution: the admin server has a feature known as auto-deployment that is enabled by default. With this feature, the server watches the applications directory for changes and automatically deploys new or changed applications that it finds there. As discussed in Chapter 5, this feature is useful during development, when the developers are using a single server as both the admin server and the application deployment server. There are several issues with this feature that make it undesirable for any environment other than a single-server development environment, however. Before discussing the issues with auto-deployment mode, recognize that disabling auto-deployment mode does not disable hot deployment or redeployment of applications. It only forces the administrator to tell the server when to hot deploy the application via one of the WebLogic Server administration tools (for example, the WebLogic Console).
The first issue with auto-deployment mode is that the admin server will try to deploy a new application only to the admin server. Although this is okay for development on a single server, it is almost never the desired behavior in multi-server environments. The second issue is that, in certain cases (probably due to bugs ), auto-deployment will cause the admin server to become confused about which applications are new and which already exist. This can cause the admin server to attempt to deploy an existing application a second time as if it were new. This leads to several potential problems, the least of which is having multiple copies of the same application running. More typically, this prevents the second copy of the application from deploying and can corrupt the first copy so that the server boots up without any copies of the application running. During this process, the admin server is saving what it believes to be the new application s configuration information to the config.xml file. This will very likely cause the config.xml file to have multiple entries for the same application. To recover from this state, you will need to use the WebLogic Console to remove unwanted copies of the application or edit the config.xml file by hand. If you choose to edit the config.xml file by hand, make sure that the admin server is not running before you try to edit the file.
Fortunately, it is very easy to disable auto-deployment by setting the weblogic .ProductionModeEnabled system property to true. The server startup scripts created by the WebLogic Configuration Wizard (to be discussed later in this chapter) have an environment variable called PRODUCTION_MODE that controls this feature; set it to true to disable auto-deployment mode.
| Best Practice | Disable auto-deployment mode for any multiserver environment. Applications can still be hot deployed using the WebLogic administration tools such as the WebLogic Console even with auto-deployment mode disabled. |
In case of an admin server crash, the admin server retains information about all of the running managed servers in the running-managed-servers.xml file. By default, the admin server will read this file and try to contact any managed servers that were previously running. Setting the weblogic.management.discover system property to false in the startup script will disable this feature; however, there is usually no reason to disable this feature.
| Best Practice | Always use the default discovery mode so that the admin server will reconnect with any managed servers already running. |
WebLogic Server now uses a two-phase deployment model. In phase 1, the admin server stages the application by distributing the new application code to each of the target servers and having each server prepare the application for deployment. Once all target servers complete phase 1, the admin server tells each target server to activate the application in phase 2. If any failures occur, the admin server rolls back the activation of the application, giving you the chance to fix the problem without leaving the application running on some servers but not on others.
As described previously, managed servers typically contact the admin server when they boot to gather their configuration and application information. If the admin server is unavailable, the managed servers will not start. Managed server independence (MSI) allows a managed server to start up using a cached copy of the configuration information and applications when the admin server is not available. When the admin server restarts, it will discover the managed servers, as previously discussed. When this happens, any managed server running in managed server independence mode will leave this mode and register itself with the admin server for future updates to their configuration.
To use this capability, the managed server must have access to the configuration file ( config.xml ) and the SerializedSystemIni.dat file. To achieve this, you can place the files on a shared disk, copy them from the admin server, or have the admin server replicate the files periodically. Currently, the replication period is every five minutes. To use the replication service, go to the server s Tuning Configuration tab in the WebLogic Console, select the Show link in the Advanced Options heading, and enable the MSI File Replication Enabled checkbox. By default, managed servers use managed server independence but do not use MSI file replication. All production environments should use managed server independence. Whether they should use MSI file replication depends on the requirements, the frequency of updates to the domain configuration, and personal preference.
| Best Practice | Production environments should always use managed server independence. If you frequently update your production deployment configuration while the system is running, make sure you have a mechanism in place to replicate changes in the config.xml file to the managed servers. MSI file replication is one easy way to implement this mechanism. |
WebLogic Server supports a flexible deployment model that is configurable via the server s Deployment Configuration tab in the WebLogic Console. The Staging Mode parameter controls the deployment model. In the default model known as stage , you place the applications on the admin server, and it pushes the applications out to the managed servers staging directories as part of phase 1 of the two-phase deployment process. By default, the admin server uses the nostage mode. In nostage mode, WebLogic Server assumes that the files are in the server s deployment directory (typically, the applications directory) and deploys them from there. In the external_stage mode the admin server does not push out the files to the managed servers staging directories. Instead, it assumes that some other process (for example, a content management system) handles this and the managed servers simply prepare and deploy the applications from the staging directories. In either nostage or external_stage mode, you are responsible for making sure that the files are in sync across all of the managed servers.
Node Manager
The node manager provides a mechanism allowing you to start and force the shutdown of WebLogic Server instances from the WebLogic Console. The admin server depends on the machine definitions for each managed server to know which node manager to contact for a specific server. By running the node manager as a daemon process started at machine boot time, the admin server is able to tell the node manager on a remote machine to start or kill a particular WebLogic Server instance. In addition, the node manager monitors the health of the servers for which it is responsible and can restart failed servers. This makes the node manager a critical part of any production deployment. By default, WebLogic Server instances allow the node manager to restart them should the JVM process terminate (either because the process dies or because the machine reboots). The node manager can monitor and restart only those servers that it starts. To disable the restart capability of a particular server, uncheck the Auto Restart Enabled checkbox on the server s Health Monitoring Configuration tab. Several additional parameters affect the behavior of this restart capability.
The Max Starts within Interval parameter tells the node manager the maximum number of times it can automatically restart the server within a specified time interval; the Restart Interval parameter value specifies the time interval. Restart Delay Seconds tells the node manager to wait for a period of time before attempting to restart the server. This parameter comes in handy in cases where the underlying operating system does not immediately release TCP listen ports for reuse ”a condition that prevents the server from re-establishing its listen ports upon restart.
WebLogic Server instances monitor their health status by monitoring the status of their critical subsystems. We discuss this in more detail in the WebLogic Administration Key Concepts section. The node manager periodically checks the health status of its servers. If any server is in the failed state, the node manager can kill and restart it. To enable the restart of servers in the failed state, use the Auto Kill If Failed checkbox. The Health Check Interval controls the frequency with which the server checks its own health as well as the frequency with which the node manager queries the server for its health status. If one of the node manager queries takes longer than the time specified by the Health Check Timeout parameter, the node manager will consider the server as being failed and will kill and restart it. Remember that the node manager monitors the health of only those servers that it starts.
In this section, we have discussed the important architectural features of the WebLogic Server architecture. This should give you a good fundamental understanding of how the product works and how the pieces fit together. Next, we will examine in more detail some important administrative concepts that you will need to understand before jumping into our discussion of how to administer a WebLogic Server domain.
EAN: 2147483647
Pages: 125
- ERP Systems Impact on Organizations
- Enterprise Application Integration: New Solutions for a Solved Problem or a Challenging Research Field?
- Context Management of ERP Processes in Virtual Communities
- A Hybrid Clustering Technique to Improve Patient Data Quality
- Development of Interactive Web Sites to Enhance Police/Community Relations