Common Troubleshooting Tools
| The most fundamental troubleshooting technique for network devices is to merely determine whether a device is reachable. Simply put, is the device up or is it down. To this end, the Packet Internet Groper (PING) utility was developed to provide a simple way to determine the reachability of a device. Determining ReachabilityPING is built upon the Internet Control Message Protocol (ICMP) and uses a system of echo and echo-reply messages to indicate whether a host is reachable. When a source host attempts to determine whether a destination host is reachable, it generates an ICMP echo packet for the destination host. When the destination host receives the echo packet, it responds with an echo-reply packet, allowing the source host to ascertain that the destination is reachable. If for some reason the destination host does not respond, the assumption is that it is unreachable. It is important to note that this is an assumption, because there are any number of reasons a host might not respond to an echo packet even though it is actually up and accessible. Therefore, it is important to understand that the failure to receive a response to an echo message does not necessarily provide any information regarding what, if anything, might be wrong. It simply means that the source host did not receive a response to the echo message. In the event that a host fails to respond to an echo request, two common messages may be generated. The first is a "request timed out" response. This typically indicates that the destination network was able to be reached but that the destination host did not respond (which indicates a problem with the destination host itself). The other response is "destination network unreachable." This message indicates that the destination network was unable to be located and typically indicates a problem with the network interconnectivity or a routing problem, not necessarily a problem with the destination host. As mentioned in Chapter 3, "TCP/IP for Firewalls," because of the nature of ICMP traffic, it is a best practice to restrict ICMP through the firewall to prevent ICMP-based attacks from being directed against hosts protected by the firewall. The obvious side effect is that if ICMP is blocked, PING cannot be used through the firewall to troubleshoot potential network problems. A commonly implemented workaround for this is to allow certain types of ICMP traffic through the firewall. These workarounds include allowing echo-reply, time-exceeded, and unreachable messages from untrusted hosts, while allowing echo messages to untrusted hosts. This allows you to ping external hosts and provides a means for the firewall to allow the three common echo message responses to return. This can be done on the Cisco Secure PIX Firewall by applying the commands in Example A-1 as a component of an access list. Example A-1. ACL to Permit Only Certain ICMP Message Types
As a best practice, your external firewall interface (and all corresponding IP addresses) should not allow any other ICMP traffic. This will prevent someone from being able to ping the firewall external IP address to determine whether it is accessible and will also protect against malicious ICMP-based traffic such as a "ping of death." Another aspect of reachability is to show how the device was reachable. In other words, what path through the network was taken to the destination host? To answer this question, the traceroute utility (in Windows, the command is tracert) was developed. Traceroute functions by sending messages that are designed to exceed the time-to-live value of the next routing hop. This causes the router to respond with a time-exceeded message. Traceroute then increments the time-to-live value (starting at 1, then 2, and so on) and generates a new packet for the destination host, allowing the source host to determine each hop that is traversed on the way to the destination host. As previously mentioned, PING does not necessarily provide any information regarding where a failure occurred that prevented a host from being reachable. As a result, traceroute is commonly implemented in conjunction with a failed PING test in an attempt to determine where in the network between the source and destination hosts that a failure might have occurred. For example, if you know that there are seven hops between the source and destination, and the destination fails to respond to an echo message, if the traceroute fails to respond after the fourth hop, you know that you should start looking at the network between the fourth and fifth hops as the likely cause of the reachability failure. Unlike PING, traceroute typically uses UDP datagrams for the transport mechanism. An exception to this is the implementation on Windows, which uses ICMP PING packets. In both cases, however, the IP time-to-live value and the corresponding ICMP time-exceeded responses are the key to how traceroute functions. For example, in Example A-2 a traceroute is issued against the remote destination 10.21.120.43, showing the three routers that are located between the source and destination hosts. Example A-2. Traceroute to Remote Destination
Determining Which Physical Addresses Are KnownA fundamental aspect of network communications is the need for two hosts to be able to physically identify and communicate with each other. This is handled in TCP/IP by the Address Resolution Protocol (ARP). ARP builds and maintains a table of MAC address to IP address associations, allowing a host to be able to physically identify local hosts and address them accordingly. If the host has the wrong physical address, however, the data will not be successfully delivered. This mis-addressing is similar to having the wrong street address on a postal letter. You can display a list of MAC addresses that a host knows about by running the arp command. For Windows hosts, you run arp -a to show the contents of the ARP cache, as displayed in Example A-3. Example A-3. Displaying the ARP Cache on Windows
For many Linux-based hosts, just run arp, as shown in Example A-4. Example A-4. Displaying the ARP Cache on Red Hat Linux
Windows-Specific ToolsIn a GUI world, the command-line utility IPCONFIG is the best and most accurate way to determine the IP address that a Windows computer is running. The reason for this is simple: dynamically assigned IP addresses and IP address information is not shown in the GUI network properties of an interface. In addition to simply providing information regarding the IP address of the host, IPCONFIG can also provide Domain Name Server (DNS) information, local MAC addresses, name resolution server information, and Dynamic Host Configuration Protocol (DHCP) server, and DHCP lease information. You can obtain this information by running the command ipconfig /all, as shown in Example A-5. Example A-5. Windows IP Configuration
Linux- and UNIX-Specific ToolsSimilar to the Windows IPCONFIG command, IFCONFIG is used to display IP addressing configuration information on UNIX- and Linux-based hosts. In addition to merely displaying the IP addressing configuration, you can use IFCONFIG to actually configure the appropriate IP settings for an interface. Example A-6 shows this IP information. Example A-6. Red Hat Linux IP Configuration
Packet-Analysis ToolsAs mentioned in Chapter 3, "TCP/IP for Firewalls," TCP/IP is the "language" that most network-connected hosts use to communicate with each other. Packet-analysis tools enable you to view the raw transmitted data, providing an incredibly valuable troubleshooting technique. Through the use of tools such as Ethereal, Microsoft Network Monitor, and TCPDump, you can observe all aspects of network communications between hosts, allowing you to detect and identify network-based problems and communications errors. Packet-analysis tools also enable you to answer the question of how, exactly, hosts are communicating with each other. A common caveat regarding packet-analysis tools is how to implement and use them in a switched network. Because of the nature of switches, packets are only delivered to a switch port if they are physically addressed to a host connected to that switch port. Consequently, if you want the packet-analysis tool to be able to capture all the traffic on the network, you need to configure the switch to forward all packets to the switch port that the packet analyzer is connected to. This configuration is commonly referred to as port mirroring or port spanning. Keep in mind that even without this, a packet analyzer will capture all broadcasts and all traffic that is directed to/from the host that it is installed on. To allow for the monitoring of traffic from switch ports, Cisco implements a technology known as Switched Port Analyzer (SPAN). With SPAN, you can define a port (or VLAN) that the traffic will be monitored from as well as a port that will be used to perform the monitoring. The switch will then forward all traffic for the monitored port to the monitoring port, allowing for packet-analysis tools to read and process the data. The commands to configure SPAN on Cisco Catalyst 29xx, 35xx, or 37xx series switches are as follows: Switch(config)# monitor session 1 source interface fastEthernet0/1 Switch(config)# monitor session 1 destination interface fastEthernet0/10 Just specify the source interface, which is the interface that you want to capture traffic from, and the destination interface, which is the interface to which the packet analyzer is connected. Most graphical packet-analysis tools can decode the captured network traffic, enabling you to view in plaintext the contents of a packet. There are three commonly implemented packet-analysis tools:
EtherealEthereal is an open source packet-analysis tool that is available from http://www.ethereal.com/. You can install Ethereal on both Windows and UNIX/Linux-based hosts; it has a common interface and functionality regardless of which type of host you install it on. You can install Ethereal on most hosts without a reboot, which makes it a good tool to install on a system that you are troubleshooting because it requires no downtime for the install. Figure A-1 shows Ethereal in action. Figure A-1. Ethereal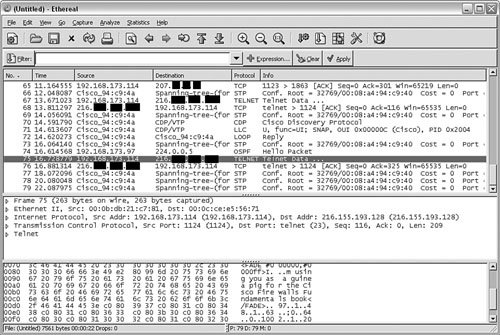 Ethereal uses three window panes to display data: the packet list (top pane), the packet details (middle pane), and the packet bytes (bottom pane). The packet list pane displays all packets that were captured, including basic elements such as the packet number (based on the capture), the time the packet was captured, the source and destination addresses, the protocol in use (if known), and a brief information field to provide additional information (typically a summary of the higher-layer data that was captured). The packet details pane displays the details of the highlighted packet (in Figure A-1, frame 75) separated by communications layers. For example, in this case, the packet details pane enables you to determine that the packet in question is data from the Yahoo! Messenger application and that it uses TCP and IP for network communications. An interesting note that really underscores how difficult it can be to block instant messenger traffic is that instead of using the normal TCP port 5050 for communications, the application decided to use TCP port 21, causing Ethereal to incorrectly display that the traffic is Telnet traffic. In fact, the reason why this traffic showed as being Telnet traffic is because the person I was communicating with was actually using an application to bypass his corporate firewall, thus enabling him to use instant messenger software. This information is valuable because it allows you to identify ports that should be permitted or denied at the firewall based on the corporate security policy, although applications that can masquerade as other ports (such as Yahoo! Instant Messenger did in this case) can make the building of the firewall ruleset extremely difficult. The packet bytes pane can be the most interesting pane to view, provided Ethereal knows how to decode the packet. The reason for this is that the packet bytes field enables you to view the actual content that was transmitted. In this case, you can see the actual message that was transmitted via Yahoo! Messenger: "I'm using you as a guinea pig for the Cisco Firewalls Fundamentals book." Another useful feature of Ethereal is the ability to follow the TCP stream, which enables you to follow the entire TCP conversation between two hosts with a simple click of the mouse. You use this feature by highlighting a TCP packet in the packet list pane, right-clicking the packet, and then choosing Follow TCP Stream from the menu. Ethereal then uses the TCP header information that has been captured to rebuild the communications session as best as it can. Figure A-2 shows a captured TCP stream. Figure A-2. Displaying a TCP Communications Stream The Yahoo! Messenger IDs have been removed to protect the innocent, but you can still see that the entire communications stream has been rebuilt, which means you can see exactly what was transmitted and what was received. Although it is kind of cool to do this for a Yahoo! Messenger session, imagine if you were capturing Telnet, SMTP, or POP3 communications and thus gaining access to usernames and passwords. Remember that although Ethereal (and other packet-analysis tools) can be great troubleshooting tools, they can also present a security risk, and therefore you should only install them when they are needed and should remove them from hosts when they are no longer needed. Otherwise, attackers can use the tool on a compromised host to gain information to allow them to compromise other systems. Microsoft Network MonitorMicrosoft Network Monitor is similar to Ethereal, but it only runs on Windows-based hosts. Microsoft Network Monitor has two versions: a free version shipped with some Windows Server operating systems that is capable of monitoring only traffic to the host on which it is installed, and a version that is a component of Microsoft Systems Management Server (SMS) that is a full-featured packet-analysis tool that is capable of capturing traffic destined/from all hosts. The biggest disadvantage of Microsoft Network Monitor over Ethereal is the inability to display captured packets in real time. With Microsoft Network Monitor, you must capture the traffic and then stop capturing to view what you captured (a process that makes it difficult to troubleshoot issues in real time). As you would expect, however, it has a relatively intuitive and easy-to-use interface, as depicted in Figure A-3. Figure A-3. Microsoft Network Monitor Capture Window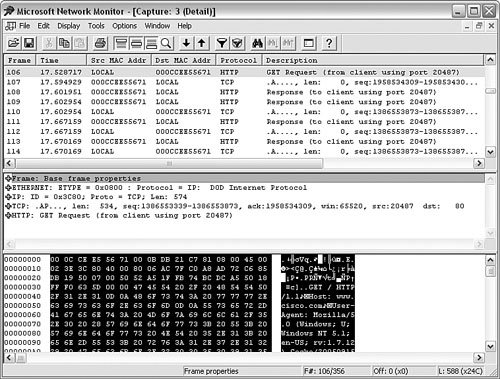 TCPDumpTCPDump is a command-line-based packet-capture tool that is used primarily in Linux/UNIX-based environments. TCPDump is also available for use on Windows-based hosts (Windump), but requires the installation of the WinPCap driver (as does Ethereal). TCPDump has a number of command-line options for use, allowing the user to log the captured packets for review as well as specify relatively complex filtering requirements. In fact, TCPDump and Ethereal use the same filtering language; so after you have learned the proper syntax on one, it is fully portable to the other. At it is simplest, you can run TCPDump with no options, which causes it to capture all packets, as shown in Example A-7. You need to be logged in as "root" on Linux/UNIX systems to use TCPDump. Example A-7. Running TCPDump to Capture Data
|
EAN: 2147483647
Pages: 147