Assessing the Fate of the Early Findings
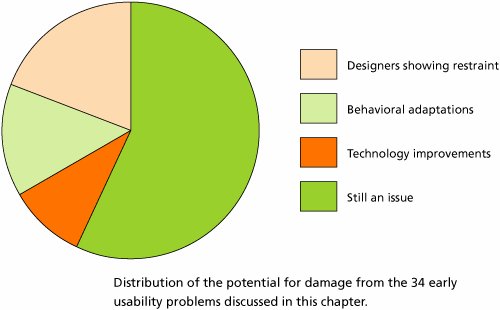
| In this chapter we have revisited 34 of the most important problem areas for Web sites in the past and given each a skull rating to indicate how important it continues to be today. Our rating scale went from zero to three skulls, so we could have awarded a total of 102 skulls if all usability problems were still as bad as when we first assessed them. However, we gave out only 59 skulls in all. This means that the usability problems we see today are 58 percent as bad as they once wereor that their potential for damage has improved by 42 percent. The pie chart shows the current status of usability problems: the proportion of issues that remain important and the proportion that is less important now, due to improvements in technology and design, and user adaptations to various design elements. Although many analysts are extremely enthusiastic about advances in Internet technology, it is interesting to note that technology accounted for only ten percent of the improvements. As the chart shows, changes in user behavior actually had a bigger impact, leading to 11 percent of the improvements. The greatest amount of progress, accounting for the most skulls lost, is due to designers showing restraint in applying annoying design techniques. Better design accounts for 21 percent of the lost skulls, so that's many usability problems we don't have to face as long as designers continue on their recent good habits. Unfortunately, there is no guarantee that they will. Future Web designers may not appreciate the damage caused to clients by violations of the early guidelines. As the problems become ever more rare on the Web, there is a significant risk that inexperienced designers will commit sins that their seasoned colleagues had to learn on. Distribution of the potential for damage from the 34 early usability problems discussed in this chapter. When we think about the fact that half of the improvement in usability problems is because Web designers have decided to follow usability guidelines more often, we realize that the percentage of problems that continues to loom over us is actually larger than the pie chart indicates. The 21 percent of problems alleviated by changes in user behavior and technology is really the only share that is gone for good. The other 21 percentusability improvements credited to better designis not set in stone. It could change any time, so in reality 79 percent of the original issues are still worth thinking about. In other words, the majority of our usability insights from the 1990s are still valid these many years later, even if some of the pitfalls are not actively hurting users today.
In general, as we continue to research different aspects of Web usability, it's striking how often the early findings are confirmed, even as the newer studies result in a more nuanced understanding and more detailed guidelines. For this reason, we expect usability issues to continue to be of major importance for many years to come. |
EAN: 2147483647
Pages: 107