Chapter 5: Time Management
|
What is a network diagram?
Network diagrams are used in many ways, from engineering to computer programming to management. In project management the network diagram is usually associated with the scheduling function. The network diagram for a schedule shows the logical relationships between the activities of the schedule for a project.
The activities are taken two at a time. The relationship between them is such that one activity is the independent activity and the other is the dependent activity. Typically, for example, this relationship shows that the independent activity must finish before the dependent activity is allowed to start.
The network diagram clearly delineates the sequence of activities that the project must follow to reach its end. Once all the relationships between the activities are shown on the diagram, the actual schedule dates can be calculated.
Tell me more …
There are two kinds of network diagrams, the "activity on arrow" network diagram and the "activity on node" network diagram. The "activity on node" network diagram is also called a "predecessor-successor" network diagram, and a "precedence" network diagram. 83
"Activity on arrow" network diagrams, as the name implies, have arrows representing the activities; any special information can be annotated to the arrows. The arrows terminate in events that are depicted as circles at the beginning and end of the arrows. Since the activities are depicted by the arrows, the arrow length can be varied in proportion with the duration of the activity.
"Activity on arrow" diagrams, as seen in Figure 5-1, were used for many years in project management schedules before the advent of personal computers. In the "good old days" there were entire rooms full of draftsmen keeping these diagrams up to date with paper and pencils. As personal computers became more popular and powerful this type of diagram fell into misuse in favor of the "activity on node" diagram. Today this method of diagramming is rarely used in project management.
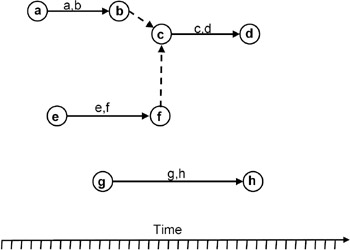
Figure 5-1: ACTIVITY ON ARROW DIAGRAM
The usual method for diagramming the "activity on arrow" diagram is to place the activities on a piece of paper with the tail of the activity arrow over the date of the activity's start and the head of the arrow over the date of the activity's planned completion. At the head and the tail of the activity arrow, circles are drawn to show the beginning and ending events associated with the activity. A time scale is not always used for this diagram. This reduces the need for many of the "dummy" activities but loses the ability to graphically depict the durations, start dates, and finish dates of the schedule.
The activity number consists of the beginning event letter and the ending event letter separated by a comma. Activity "a, b" is an arrow with event "a" and "b" at each end. By tradition lowercase letters are used for the events and activity numbering scheme.
If an activity is dependent on another independent activity, the tail of the dependent activity is connected to the head of the independent activity.
In the event that the independent activity has more than one activity depending on it, a dummy activity, indicated as a dotted or dashed arrow, with zero duration, can be shown.
"Activity on node" network diagrams, as seen in Figure 5-2, have the activity information written in small boxes that are the nodes of the diagram. Arrows connect the boxes to show the logical relationships between pairs of the activities. It is important to note here that in network diagramming, circles connected by arrows always represent "activity on arrow" diagramming, and boxes connected by arrows always represent "activity on node" diagrams.
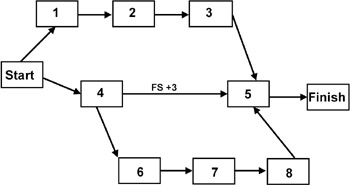
Figure 5-2: ACTIVITY ON NODE DIAGRAM
In this type of diagram the activity numbers are usually sequential and numeric. The number of the independent activity is called the predecessor and the number of the dependent activity is called the successor. Each activity has a unique number.
The arrows in this diagram show only the logical relationship between the activities. The most common of these is the "finish-start" relationship, which is the default and is generally not shown explicitly in the diagram. It is so commonly used that if there is no name given to the relationship, it is assumed to be "finish-start". In a "finish-start" relationship between two activities, the independent activity must finish before the dependent activity is allowed to have its start scheduled.
There are several other relationships possible: "Start-start" and "finish-finish" are useful in diagramming to show the other possible ways in which activities can be related. In the "start-start" relationship the independent activity must start before the dependent activity is allowed to start. In the "finish-finish" relationship the independent activity must finish before the dependent activity is allowed to finish. A couple of examples are in order. If we were writing a book, the editing process could start as soon as some of the book had been written, but the editing process could not be finished until the writing of the book was complete. If we were making Thanksgiving dinner for the family, we could have a "start-start" relationship between putting the plates on the table and placing the silverware. We can't tell where the silverware goes until at least some of the plates are placed on the table. We could have a "finish-finish" relationship between cooking the turkey and cooking the sweet potatoes. The potatoes and the turkey should come out of the oven at the same time so they can be served hot.
The "start-finish" relationship is seldom used but is available in most project management software packages. This kind of relationship is unusual and is normally represented in some other logical way. It is difficult to find examples of this kind of relationship. We leave it up to the readers to find examples. If you can think of one, please send us the example by e-mail at mnewell@psmconsult.com.
In addition to the logical relationships between pairs of activities in the diagram, there are offsets in the relationships as well. These offsets are called "leads" and "lags". A lead is shown as a negative number added to the relationship and a lag is shown as a positive number added to the relationship. When these are used, the relationship is shown explicitly, and the lead or lag is shown added to it or subtracted from it as in the relationship between activity 4 and activity 5 in Figure 5-2.
Depending on your preference, a network diagram can be shown with or without two special activities to show the start and finish of the project. If these are used they are generally shown as milestones in that they both have a duration of zero. They are helpful if there are several different project activities that have no predecessors at the beginning of the project or if there are several activities at the end of the project that have no successors. The activities at the beginning of the project are then made to have the start activity as the predecessor for each of them, and the activities at the end of the project are made to have the finish activity as their successor. In this way it is easy to find the start and finish of the project.
|
EAN: 2147483647
Pages: 126