Monitoring Server Activities
Apache provides two unique built-in methods to check the performance of your Web server. The server-status handler can be configured to show information about server processes. The server-info handler can be configured to display a detailed summary of the Web server’s configuration. You can activate these services by adding the following lines to the /etc/httpd/conf/httpd.conf file, respectively:
<Location /server-status> SetHandler server-status Order deny,allow Deny from all Allow from .handsonhistory.com </Location> <Location /server-info> SetHandler server-info Order deny,allow Deny from all Allow from .handsonhistory.com </Location>
In this example, all computers in the handsonhistory.com domain can display the server- info and server-status pages. You can change handsonhistory.com to the name of any domain or host that your Apache server is hosting.
Displaying server information
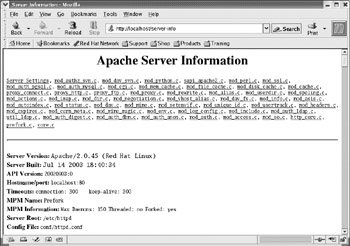
The Server Information (server-info) page contains the server version information and various general configuration parameters and breaks up the rest of the data by module. Each loaded module is listed, with information about all directives supported by that module, and the current value of any defined directives from that module.
The Server Information is usually quite verbose and contains much more information than can be displayed in Figure 21-3, which shows only the links to each module’s section and the general Server Settings section.

Figure 21-3: The server-info page displays server and module information.
Displaying server status
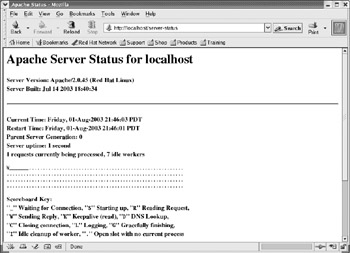
The contents of the server-status page include version information for the server, the current time, a timestamp of when the server was last started, and the server’s uptime. The page also details the status of each server process, choosing from several possible states (waiting for a connection, just starting up, reading a request, sending a reply, waiting to read a request before reaching the number of seconds defined in the KeepAliveTimeout, performing a DNS lookup, logging a transaction, or gracefully exiting).
The bottom of the server-status page lists each server by process ID (PID) and indicates its state, using the same possible values. Figure 21-4 shows an example of this page.

Figure 21-4: The Apache server-status page displays general Apache information and reports on individual server process activities.
The server-status page can also perform automatic updates to provide even closer monitoring of the server. If the URL http://localhost/server-status?refresh=40 is specified, the server-status page displayed in your browser will be updated every 40 seconds. This enables a browser window to be devoted entirely to continually monitoring the activities of the Web server.
By default, only basic status information is generated. If you would like to generate full status information, you need to turn on the ExtendedStatus directive by uncommenting the last line in the following code:
# # ExtendedStatus: controls whether Apache will generate "full" status # information (ExtendedStatus On) or basic information (ExtendedStatus # Off) when the "server-status" handler is called. The default is Off. # #ExtendedStatus On
Further security of server-info and server-status
Because both the server-info and server-status pages contain private information that should not be accessible to just anyone on the network, there are a few extra ways you can secure that information. You can restrict that information only to the local host; however, in some environments that may not be practical.
If you must allow other machines or networks access to such detailed configuration information, allow only as many machines as is necessary, and preferably only those machines on your local network. Also, be aware that, in the wrong hands, the information displayed by the server-info and server-status pages can make it much easier for the security of your entire machine to be compromised.
It may also be beneficial to change the URL used to reference both of the aforementioned pages. This is an example of “security through obscurity,” which should not be relied on but which can make it just a little more difficult for unauthorized individuals to obtain information about your Web server’s configuration (particularly if you cannot restrict such connections to the local network). To accomplish this, simply change the filename in the Location directive, as in the following lines:
<Location /server.information.page>
and:
<Location /server.status.page>
Logging errors
The error log contains messages generated by the server that describe various error conditions. The ErrorLog and LogLevel directives in the httpd.conf file (as described in the section on configuring the server) can modify the filename and the amount of information that is logged. The default file is /etc/httpd/logs/error_log (which is a link to /var/log/httpd/error_log). Here are a few sample lines from the error log:
[Thu Apr 15 10:29:13 2004] [notice] Apache/2.0.48 (Fedora) configured -- resuming normal operations [Thu Apr 15 10:43:07 2004] [error] [client 127.0.0.1] client denied by server configuration: /var/www/html/server-status [Thu Apr 15 10:06:42 2004] [error] [client 127.0.0.1] File does not exist: /var/www/html/newfile.html [Thu Apr 15 01:12:28 2004 [notice] caught SIGTERM, shutting down
The first line indicates that the server has just been started and will be logged regardless of the LogLevel directive. The second line indicates an error that was logged to demonstrate a denied request. The third line shows an error, which represents a request for a file that does not exist. The fourth line, also logged regardless of the LogLevel directive, indicates that the server is shutting down. The error log should also be monitored periodically because it will contain the error messages from CGI scripts that might need repair.
Logging hits
Every incoming HTTP request generates an entry in the transfer log (by default, /etc/httpd/logs/access_log, which is a link to /var/log/httpd/access_log). Statistics packages and log file analysis programs typically use this file because manually reading through it can be a rather tedious exercise. (See the information on LogSentry in Chapter 14.)
The format of the transfer log can be altered by the LogFormat and CustomLog directives in the httpd.conf file (as described in the "Configuring the Server" section). If you attempted to access http://localhost/ following the installation procedure (from Figure 21-1), the following lines (in the "common" format) would be written to the access_log:
127.0.0.1 - - [05/Nov/2004:00:23:33 -0600] "GET / HTTP/1.1" 403 3931 "-""Mozilla/5.0 (X11; U; Linux i686; rv:1.7.3) Gecko/20041002 Firefox/0.10.1" 127.0.0.1 - - [05/Nov/2004:00:23:34 -0600] "GET /icons/apache_pb2.gif HTTP/1.1" 200 2414 "http://localhost/" "Mozilla/5.0 (X11; U; Linux i686; rv:1.7.3) Gecko/20041002 Firefox/0.10.1" 127.0.0.1 - - [05/Nov/2004:00:23:34 -0600] "GET /icons/powered_by_fedora.png HTTP/1.1" 200 2243 "http://localhost/" "Mozilla/5.0 (X11; U; Linux i686; rv:1.7.3) Gecko/20041002 Firefox/0.10.1"
The Apache Test Page actually is an error condition (403), which indicates that the Apache server is running, but that administrator of the server hasn't added a home page yet. The next two lines show the Apache (apache_pb2.gif) and Fedora (powered_by_fedora.png) icons that appear on the test page, respectively.
Viewing the server-info and server-status pages (as shown in Figures 21-3 and 21-4, respectively) generated the following entries:
127.0.0.1 - - [15/Jun/2004:23:40:41 -0400] "GET /server-info HTTP/1.1" 200 42632 127.0.0.1 - - [15/Feb/2003:23:41:49 -0400] "GET /server-status HTTP/1.1" 200 1504
The denied attempt to access the server-status page logged the following line (note the 403 server response code):
127.0.0.1 - - [15/Jun/2004:23:43:07 -0400] "GET /server-status HTTP/1.1" 403 211
Analyzing Web-server traffic
The webalizer package can take Apache log files and produce usage reports for your server. Those reports are created in HTML format so you can display the information graphically. Information is produced in both table and graph form.
To use the webalizer command, the webalizer package must be installed. You can run webalizer with no options and have it take the values in the /etc/webalizer.conf files to get the information it needs. As an alternative, you can use command-line options to override settings in the webalizer.conf file. To use the defaults, simply run the following:
# webalizer
If all goes well, the command should run for a few moments and exit silently. Based on the information in the /etc/webalizer.conf file, the /var/log/httpd/access_log log file is read and an index.html file is copied to the /var/www/html/usage/ directory. You can view the output by opening the file in any browser window. For example, you could type the following:
# mozilla /var/www/html/usage/index.html
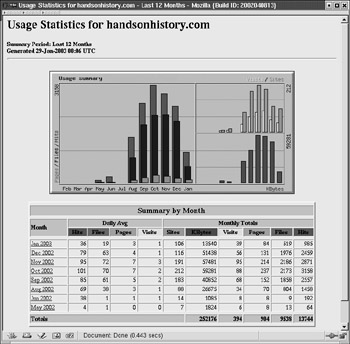
The output report shows a 12-month summary of Web server activity. On the bar chart, for each month a green bar represents the number of hits on the Web site, a dark blue bar shows the number of different files hit, and a light blue bar shows the number of pages opened. It also shows data for the number of visits and the number of sites that visited in the right column. The amount of data transferred, in kilobytes, is displayed as well.
Figure 21-5 shows an example of a webalizer output file for a Web server that has been running for several months.

Figure 21-5: Webalizer displays Web data in chart and column formats.
Below the chart, a table shows daily and monthly summaries for activity during each month. Users can click the name of a month to see detailed activity.
| Tip | Because Webalizer supports both common log format (CLF) and combined log format, it can be used to display information for log files other than those produced for Apache. For example, you could display statistics for your FTP server or Squid server. |
Several other software tools are available for analyzing transfer statistics. The accompanying sidebar on statistics packages available for Fedora and other Red Hat Linux systems describes some of these tools.
Analyzing the transfer log by hand isn’t much fun. Several packages have beenwritten to automate this task, including the following two:
-
Analog — This free log-file analyzer is very fast and easily configurable, and it produces very detailed output (including bar graphs and hypertext links). More information can be found at www.analog.cx.
-
AWStats — The Advanced Web Statistics tool (awstats.sourceforge.net) produces graphical statistics representing Web-server access. AWStats can work with log files in the Apache common log format, as well as log files from sendmail, FTP and other network servers. It can report statistics, such as the number of people who have visited, visits made per person, the domain and country of each visitor, and the number of visits made by robots.
EAN: 2147483647
Pages: 286