8 - Mechanics of Breathing
Editors: Shields, Thomas W.; LoCicero, Joseph; Ponn, Ronald B.; Rusch, Valerie W.
Title: General Thoracic Surgery, 6th Edition
Copyright 2005 Lippincott Williams & Wilkins
> Table of Contents > Volume I - The Lung, Pleura, Diaphragm, and Chest Wall > Section III - Thoracic Imaging > Chapter 11 - Magnetic Resonance Imaging of the Thorax
function show_scrollbar() {}
Chapter 11
Magnetic Resonance Imaging of the Thorax
Warren B. Gefter
Chest radiography is almost always the first imaging study for evaluating known or suspected thoracic disease. Subsequent imaging may include computed tomography (CT), conventional contrast angiography, or echocardiography. Magnetic resonance (MR) imaging has been used primarily as a problem-solving tool: It clarifies the findings of other imaging modalities. However, MR imaging is also beginning to establish itself as the primary modality for evaluating a limited set of diseases. Unique strengths of MR imaging include high soft tissue contrast, multiplanar imaging, and noninvasive vascular imaging. From a technical standpoint, the thorax presents a challenge for MR imaging. Image quality is degraded by pulsatile blood flow, cardiac and respiratory motions, and the heterogeneous magnetic susceptibility of lung. Numerous technical innovations have remedied some of these problems. Yet physicians have been slow to embrace MR imaging. The relatively high cost and limited availability of MR imaging may be contributing factors. Clinical outcome studies will be needed to determine whether MR imaging is cost effective for patients with thoracic disease. The goals of this chapter are to introduce the principles and practice of thoracic MR imaging and to familiarize the reader with the strengths and weaknesses of this rapidly evolving modality.
Flexibility is both a strength and weakness of MR imaging. The number of ways to image the thorax with MR imaging is virtually unlimited, but not all imaging sequences can be applied to every patient. The MR imaging examination should be tailored to answer a specific clinical question or evaluate a specific pathologic entity. Thoracic MR imaging is poorly suited to an unfocused survey or search and destroy examination. The referring clinician should provide a relevant clinical history to help the radiologist perform a proper MR study. Additional clinical information may be obtained by the technologist or radiologist by interviewing the patient before the examination. Excellent communication between the surgeon and radiologist helps ensure that MR examinations will be appropriate, focused, and efficient.
Theory and Technique
General Principles
To the uninitiated, MR images are enigmatic. The appearance and physical basis of soft tissue contrast are different for MR imaging and CT. Likewise, the mechanism of soft tissue enhancement by exogenous contrast materials is different for these two studies. In addition, the artifacts that must be understood to render a correct diagnostic interpretation differ between MR imaging and CT. These phenomena and others can be understood with a modicum of basic MR imaging theory. Although a complete theoretical description of MR imaging lies in quantum mechanics, many important concepts can be understood with simple analogies from classical physics.
MR imaging represents an interaction between certain atomic nuclei, an external magnetic field, and applied radiofrequency (rf) waves. Atomic nuclei with an odd number of protons or neutrons exhibit a property called spin, a quantum mechanical phenomenon that does not connote a spinning motion. However, for heuristic purposes, it can be helpful to consider spin in the ordinary sense of a spinning top. In the human body, the most abundant nuclear species with spin is the hydrogen nucleus or proton. The two tissues with the highest proton concentrations or proton densities are fat and water; pure water has a proton concentration of 110 M. Tissue proton density is proportional to MR signal intensity and is therefore a source of soft tissue contrast. Other nuclei in the human body, such as fluorine, phosphorus, and sodium, also exhibit spin but are present at much lower concentrations. Noble gases such as helium 3 (3He) and xenon 129 (129Xe) exhibit spin and can be hyperpolarized for use as inhalational contrast agents. Currently, hydrogen
P.166
is the only nucleus routinely used in clinical MR imaging, although this could change in the future.
Spin
The spin of the positively charged hydrogen nucleus creates a small magnetic moment, analogous to a tiny bar magnet. In MR parlance, magnetic moments are called spins. The magnitude and direction of a spin can be represented by a small vector. An ensemble of spins is randomly oriented in the absence of an external magnetic field. However, in the presence of an external magnetic field (designated B0 and, by convention, oriented in the +Z direction of a Cartesian coordinate system), spins one-half nuclei (e.g., 1H) establish a thermal equilibrium distribution in which they align either parallel or antiparallel to B0. A slight excess of spins aligns with B0 because this is a lower-energy condition. At a magnetic field strength of 1.5 tesla, typical for a high-field MR imaging scanner, only seven excess spins per million are aligned with B0. MR signal intensity is proportional to the tissue density of excess spins. Although pure water has a total spin density of 110 M, the excess spin density is considerably lower at 0.8 mM. The stronger the external magnetic field, the greater the excess spin density. This explains why higher field strength MR imaging scanners usually produce better (i.e., less noisy) images.
 |
Fig. 11-1. MR pulmonary ventilation study with hyperpolarized 3He gas in a normal volunteer. Sagittal MR images were acquired through the same location in the right lung before (A) and after (B D) inhalation of hyperpolarized gas (left is anterior, right is posterior). The MR signal arises from hyperpolarized gas in the bronchoalveolar spaces. The MR signal intensity decreases as the section of right lung is reimaged (B D) because of loss of magnetization. The major fissure (B, arrowheads) is seen as a signal void. Courtesy of Dr. Rahim R. Rizi. |
Hyperpolarization
If the distribution of spins between the parallel and antiparallel states could somehow be altered from the thermal equilibrium distribution, it would be possible to increase MR signal intensity. In fact, a nonequilibrium spin distribution has been achieved with the noble gases 3He and 129Xe using optical pumping to hyperpolarize the spins. Hyperpolarization increases the net magnetization by almost 100,000-fold. Despite the relatively low concentration of spins in a noble gas (about 45 mM under ordinary conditions), the MR signal is comparable with that of nonhyperpolarized water. Hyperpolarized noble gases offer the intriguing possibility of directly imaging air-containing spaces in the body such as the lungs (Fig. 11-1), tracheobronchial tree, and paranasal sinuses.
Nuclear Precession
A key concept is that spins precess around the axis of the external magnetic field in a manner similar to the wobble of a spinning top. The precession frequency is directly proportional to the strength of B0 and is called the Larmor frequency. The proton Larmor frequency in a 1.5-tesla MR imaging scanner is about 64 MHz, similar to the frequency of an FM radio station. Water protons precess
P.167
slightly faster than fat protons, 220 Hz faster at 1.5 tesla. This small frequency difference can be exploited in chemical shift techniques such as opposed-phase MR imaging and frequency-selective fat suppression.
The vector sum of all spin magnetic moments is called net magnetization. Only excess spins contribute to net magnetization; all other spins sum to zero. At equilibrium, the net magnetization points in the +z direction, where it is called longitudinal magnetization. Longitudinal magnetization does not produce an MR signal. The plane perpendicular to the Z axis is the XY plane, and magnetization that lies in this plane is called transverse magnetization. At equilibrium, no transverse magnetization occurs. MR signal is derived exclusively from transverse magnetization. Transverse magnetization produces a time-varying magnetic field that induces a tiny alternating current in a wire loop receiver placed near the source. These tiny currents are digitized, amplified, combined, and Fourier transformed to yield the MR image.
Coils
Receivers or coils are the physical entities that detect the faint signal emanating from the patient's tissues. Coils also transmit rf, thereby delivering rf energy into the patient. Coils can be specially configured to receive signal from anatomic regions of various sizes and shapes. The two most frequently used coils for thoracic imaging are the body coil and phased array torso coil. The body coil is built into the bore of most superconducting MR imaging scanners and can be used for imaging large anatomic regions, such as the entire thorax. The maximum craniocaudal field of view of the body coil is limited to about 48 cm. The phased array torso coil is used for imaging slightly smaller anatomic regions, such as the heart or thoracic aorta, but with better signal-to-noise and higher spatial resolution than the body coil. Special surface coils can be used for imaging small, well-defined regions, such as a portion of a rib, with high spatial resolution. In selecting a particular coil, one makes a tradeoff between anatomic coverage and spatial resolution.
Resonance
Radiofrequency waves interact with spin magnetic moments when the rf frequency is tuned to the spin precession frequency. This concept is called resonance and is so important that it has been incorporated into the name MR imaging. Short rf pulses are used to change the orientation of or to tip the net magnetization. For example, a 90-degree rf pulse, or 90-degree flip angle, tips longitudinal magnetization into the transverse plane, where it will generate a signal. A 180-degree rf pulse rotates transverse magnetization from the +x to the -x direction, in which case it is called a 180-degree refocusing pulse. Spin echo and fast spin echo sequences use both 90-degree and 180-degree rf pulses. Gradient echo sequences, such as those used in MR angiography, generally use rf pulses smaller than 90 degrees. Unlike spin echo sequences, gradient echo sequences do not use 180-degree refocusing pulses.
T1 and T2 Relaxation
A major source of soft tissue contrast in MR imaging is the varied relaxation behavior of hydrogen nuclei in different tissues. The two parameters that describe tissue relaxation are T1 and T2. MR imaging sequences can be designed to accentuate differences in T1 or T2, but not both at the same time. Images that accentuate tissue T1 differences are called T1 weighted, whereas those that accentuate T2 differences are called T2 weighted. It is often possible to characterize a tissue based on its relaxation behavior. The T1 and T2 behavior of a tissue may vary with magnetic field strength. Thus, soft tissues may appear somewhat different when they are imaged on MR imaging scanners having different magnetic field strengths.
T1 is the characteristic time for spins to reestablish a thermal equilibrium distribution. At equilibrium, no transverse magnetization occurs, only longitudinal magnetization. A 90-degree rf pulse, for example, temporarily disturbs the equilibrium by tipping all longitudinal magnetization into the transverse plane. Over time, the longitudinal magnetization increases exponentially from zero to the equilibrium value, which, under ordinary conditions, is also the maximum value. T1 relaxation processes involve an exchange of energy between spins and their environment (the lattice), which is why T1 is also called spin-lattice relaxation.
Proton T1 values vary among tissues, and these differences generate soft tissue contrast on T1-weighted MR images. Tissues with a short T1 appear bright, and those with a long T1 appear dark. Many strategies exist for introducing T1 weighting. Consider, for example, the behavior of longitudinal magnetization, initially at equilibrium, acted on by a train of 90-degree pulses separated by a repetition time of TR. If TR is much longer than T1, the longitudinal magnetization returns to equilibrium before the next 90-degree pulse arrives. However, if TR is shorter than T1, the longitudinal magnetization never reaches equilibrium. Instead, it reaches a steady-state level that is less, sometimes much less, than its maximum value. And after the 90-degree pulse, the transverse magnetization and the MR signal it produces are also less than its maximum value. Fat protons have a shorter T1 than water protons. To create T1 contrast between fat and water, choose a TR that is longer than the T1 of fat but shorter than the T1 of water. The result is that fat appears brighter than water. Conversely, a very long TR virtually eliminates T1 contrast from an image. The image acquisition time increases directly with TR, so long TR pulse sequences are lengthy.
P.168
T2 is the characteristic time for decay of transverse magnetization. T2* is similar to T2 but includes spin dephasing caused by magnetic field gradients and inhomogeneities. After an rf pulse creates transverse magnetization, all spins are in phase, which is to say that their magnetic moments all point in the same direction. At this time, the vector sum, the transverse magnetization, assumes a maximum value. Subsequently, as the spins begin to interact with one another and with their environment, they fan out or dephase in the transverse plane. Eventually, the spins become randomly oriented, and the vector sum vanishes. Any process that increases the rate of spin dephasing also increases the T2 relaxation rate or, equivalently, shortens T2. In the human body, T2 relaxation processes are either intrinsic to a tissue, related to tissue interfaces, or caused by external causes such as magnetic field inhomogeneity. Intrinsic T2 relaxation arises from the mutual interactions of spins within a tissue. It is generally true that greater interaction leads to T2 shortening. This is why T2 is also called spin-spin relaxation. Water protons have a long T2 because water molecules move so rapidly, on an MR imaging time scale, that the spins cannot interact effectively with one another.
Like T1, proton T2 values also vary among tissues, and these differences generate soft tissue contrast on T2-weighted MR images. Tissues with a short T2 appear dark, and those with a long T2 appear bright. Thus, water protons, which have a long T2, appear bright on T2-weighted images. In the lung, heterogeneous magnetic susceptibility markedly shortens T2 and T2*. The complex architecture of the lung juxtaposes magnetically dissimilar tissues (i.e., those with different magnetic susceptibilities), specifically water in the lung interstitium and air in the bronchoalveolar tree. Consequently, normal lung parenchyma appears as a black signal void on most MR images. The low proton density of lung tissue also contributes to its MR appearance.
Echoes
Transverse magnetization decays rapidly, especially when magnetic gradients are on. The MR signal produced by the rapidly decaying transverse magnetization, which is called a free induction decay, cannot be used to make an ordinary MR image because it occurs too soon after the rf pulse. To introduce a temporal separation between the rf pulse and the MR signal, one forms an echo of the initial free induction decay. Echoes occur when dephasing spins are refocused. Refocusing causes the transverse magnetization and MR signal to pass through a second maximum, the echo. The delay between the initial rf pulse and the echo is called theecho time (TE). The maximum signal from the first echo is always less than that of the free induction decay. The signal decrement reflects T2 decay over the period TE. Thus, TE can be used to control the amount of soft tissue T2 contrast. A short TE decreases T2 contrast, whereas a long TE increases it.
Many strategies exist for producing an echo, but only two are used routinely in clinical MR imaging: the 180-degree refocusing pulse and magnetic gradient reversal. These two types of echoes, and the MR imaging sequences based on them, are called spin echo and gradient echo. The strategy used to form the first echo can be repeated to form a second echo, a third echo, and so on. Fast spin echo sequences use multiple, equally spaced 180-degree refocusing pulses, whereas echo-planar sequences employ multiple magnetic gradient reversals. Hybrid spin echo/gradient echo sequences also exist but are not widely used. The tradeoffs between spin echoes and gradient echoes relate to speed, image noise, soft tissue contrast, and suitability for vascular imaging.
IMAGING
Spatial Encoding
During each echo, the receiver coil detects a cacophony of MR signals from billions and billions of hydrogen nuclei. The spatial location of these signals must be determined to make an image, a concept known as spatial localization or spatial encoding. MR imaging uses magnetic field gradients to localize spins in space. A magnetic field gradient, or simply a gradient, is a magnetic field whose strength varies linearly with position. MR imaging scanners are equipped with X, Y, and Z gradients. These can be used alone or in combination to produce a resultant gradient with any oblique orientation. The gradients add or subtract a small amount of magnetic field from the much larger B0 field. As the magnetic field changes, so does the precession frequency of the hydrogen nuclei. In effect, the gradient sets up a map between spatial location and precession frequency. Exogenous metals, such as surgical clips, prosthetic joints, and vascular stents, may distort the gradient and the map and thereby produce substantial image artifact.
MR image data can be spatially encoded in two or three dimensions. In two-dimensional (2D) imaging, a specially constructed rf pulse excites spins (i.e., creates transverse magnetization) in a thin slice of tissue while a magnetic gradient is on. The thickness and orientation of the excited slice are controlled by the strength and orientation of the gradient as well as the rf pulse. MR images can be acquired in any plane: axial, sagittal, coronal, or oblique. In contrast, the orientation of CT images is physically constrained by the position of the patient within the gantry. By exciting hydrogen nuclei only within a single slice, the spatial encoding problem is reduced to two dimensions. These two dimensions are spatially mapped using frequency encoding in one direction and phase encoding in the other. The number of phase (NP) and frequency (NF) encoding steps is called the matrix, and this, in combination with the field of view, determines the in-plane spatial resolution of the MR image. The effect is to divide the imaged slice into NP NF
P.169
rectangular picture elements called pixels. A voxel is a three-dimensional (3D) volume element whose face is a pixel and whose height is the slice thickness. The dimensions of the voxel determine the spatial resolution of an MR image.
Frequency encoding steps are time efficient; thus, little penalty exists for increasing spatial resolution in this direction. However, phase encoding steps are time inefficient: Each additional step requires an additional TR period. The acquisition time for a conventional 2D spin echo or gradient echo imaging sequence is TR NP the number of signal averages. A typical matrix for a thoracic MR imaging is 256 frequency-encoding steps and 128 to 192 phase-encoding steps; the larger matrix element is assigned to the time-efficient frequency-encoding direction.
In 3D imaging, the rf pulse excites a rectangular volume of tissue, rather than a single slice, also in the presence of a magnetic gradient. The volume may be oriented in any plane or obliquity. The excited spins are spatially localized in three dimensions using frequency encoding in one direction and phase encoding in each of the other two directions. The acquisition time for a 3D imaging sequence is TR NP-1 NP-2 the number of signal averages. To keep acquisition times reasonably brief, 3D imaging almost always uses a short TR fast gradient echo sequence. Three-dimensional imaging finds its greatest application in MR angiography.
Anatomy of a Pulse Sequence
A pulse sequence is the series of rf pulses and magnetic gradients that produces MR images at a specified location, in a specified anatomic plane, and with a specified soft tissue contrast. A pulse sequence is considered MR software, as opposed to the superconducting magnetic, the gradient coils, and the rf coils, which are MR hardware. Consider the organization of a commonly used pulse sequence: the 2D axial spin echo sequence with a 256 128 matrix. The sequence consists of a train of 128 nearly identical units, one unit for each phase-encoding step. A unit begins with a slice-selective 90-degree rf pulse that plays out while a gradient is on. Next, a 180-degree refocusing pulse plays out at time TE/2 and forms an echo at TE after the 90-degree pulse. The echo is acquired in the presence of a frequency-encoding gradient, also called a readout gradient. The electronics of the MR imaging scanner digitize the echo into 256 data points. While the echo is evolving, a phase-encoding gradient is turned on for a brief period. The strength of this gradient is stepped, with one step for each phase encode, from negative to positive values. The next unit begins with a 90-degree pulse at time TR after the previous 90-degree pulse. The pulse sequence ends after 128 units of 90-degree pulse, 180-degree pulse-echo are completed.
The 2D spin echo sequence can be T1 or T2 weighted by selecting the appropriate TR and TE. A short TR and short TE produce a T1-weighted image, whereas a long TR and long TE produce a T2-weighted image. Proton-density or spin-density weighting is obtained with a long TR and short TE. Proton-density weighting is rarely used in the thorax because it provides little additional diagnostic information. Because acquisition times for a conventional T2-weighted spin echo sequence are 10 minutes or longer, this sequence is being supplanted by the faster T2-weighted fast spin echo sequence. Spin echo and fast spin echo sequences can be acquired in any plane. These sequences are used primarily to identify normal and abnormal soft tissue structures, assess tissue T1 and T2 signal intensity, and determine anatomic relationships.
Gradient echo sequences generally sacrifice soft tissue contrast for imaging speed. Many of the technologic advances in MR imaging, such as stronger and faster gradients, faster receivers, and more time-efficient pulse sequences, are manifest in a variety of ultrafast gradient echo sequences. Ultrashort TR (<4 ms) and TE (<2 ms) gradient echo sequences are now standard on most commercially available, high-performance, clinical MR imaging scanners. Short acquisition times allow gradient echo images to be acquired during suspended respiration. Gradient echo images can be T1 weighted by using a short TR/TE, a large flip angle (60 to 90 degrees), and spoiling of residual transverse magnetization. T1-weighted fast gradient echo sequences are particularly useful for detecting soft tissue enhancement by gadolinium-based (Gd) contrast agents. For example, breath-hold, Gd-enhanced 3D MR angiography is based on a heavily T1-weighted ultrafast 3D gradient echo sequence. 2D and 3D gradient echo sequences, particularly when used with flow compensation gradients, make flowing blood appear bright, but without administration of exogenous contrast materials. Cine MR imaging is similarly based on 2D gradient echo sequences.
Cardiac and Respiratory Gating
Cardiac and respiratory motions can degrade MR image quality in the thorax. Strategies such as cardiac gating, respiratory compensation, and respiratory gating have been devised to minimize image degradation. Cardiac gating synchronizes the MR image acquisition with an electrocardiographic (ECG) tracing derived from four ECG leads placed on the precordium or back. A cardiac-gated T1-weighted spin echo sequence uses the R-R interval as the TR. By contrast, a cardiac-gated T2-weighted spin echo sequence uses a multiple of the RR interval, such as RR 3 or RR 4, as the TR. Adjusting the trigger delay between the R wave and the 90-degree pulse allows imaging to be performed anywhere between systole and diastole. Cardiac gating is most effective when the RR interval is nearly constant, such as in normal sinus rhythm. Conversely, cardiac gating is less effective when the RR interval is highly variable, such as in atrial fibrillation. Frequent ectopic beats also diminish the success of cardiac gating. Pericardial effusion may cause low ECG voltage and poor cardiac gating.
P.170
Bradycardia increases the image acquisition time but does not adversely affect image quality, although a long RR interval may cause T1-weighted images to appear proton density weighted. Cardiac gating is standard in spin echo and fast spin echo imaging of the thorax.
Respiratory motion blurs images and causes ghosting artifact in the phase-encoding direction. The simplest remedy is a breath-hold acquisition, but only certain fast gradient echo and fast spin echo acquisitions are amenable to breath holding. For longer acquisitions, such as 2D spin echo, an option called respiratory compensation can reduce image degradation. Respiratory compensation refers to any of several methods of reordering phase-encoding steps to minimize the effects of respiratory motion. A bellows placed around the patient's chest or upper abdomen senses the respiratory excursion and transmits the information to the MR imaging scanner. Respiratory compensation is only moderately effective and functions poorly when respirations are irregular. Respiratory triggering is a recent innovation. With this technique, image data are collected only during the quiet period of expiration. A drawback of respiratory triggering is that it increases image acquisition times. Apneic periods and irregular respirations may interfere with the proper functioning of respiratory triggering. Another new respiratory gating method called MR navigator echo monitors diaphragmatic position. This method is not yet widely available on clinical MR imaging scanners.
Cine
Cine MR imaging creates a series of images at a single location at multiple time points in the cardiac cycle. The name cine MR imaging derives from the movielike appearance of the images when displayed consecutively in a loop. Using the ECG tracing, cine sequences divide the R-R interval into 8 to 24 time intervals and then acquire image data during each interval using a 2D gradient echo sequence. Laminar blood flow appears bright on cine images. Turbulent or abruptly accelerating flow produces signal loss within bright blood. This feature makes cine MR imaging useful for detecting flow abnormalities associated with stenotic and incompetent heart valves, ventricular septal defects, and vascular and anastomotic stenoses. Cine MR imaging is also used to study cardiac motion, the motion of intracardiac masses, and blood flow within an aortic dissection. However, for many of these conditions, echocardiography remains the primary imaging modality. A new version of cine MR imaging, which permits imaging during suspended respiration, uses an ultrafast gradient echo sequence and segmented k-space acquisition. Another new ultrafast cine gradient echo sequence, called true steady-state free precession gradient echo (variously called TrueFISP, FIESTA, and balanced FFE by different vendors), produces very bright blood and exceptional soft tissue contrast between blood and myocardium. Although ultrafast breath-hold cine MR imaging reduces respiratory artifact, its short TE may decrease the conspicuity of turbulent blood flow. Another innovation, spatial modulation of magnetization, has augmented the capabilities of cine MR imaging and permits detailed analysis of cardiac wall motion. Gradient echo cine MR imaging also can be combined with velocity-encoding gradients along one or three orthogonal directions. This pulse sequence can be used to quantify flow velocity and volume flow rates in blood vessels. New ultrafast versions of this pulse sequence permit velocity and flow measurements to be performed during one or several breath-holds. Important differences exist between the flow data acquired with velocity-encoded cine MR imaging and Doppler ultrasound: Doppler interrogates the velocity spectrum from a small sample volume, whereas MR imaging provides a flow velocity for each pixel in the image. Doppler also has higher temporal resolution.
Magnetic Resonance Contrast Agents
The intravenous MR contrast agents used in routine clinical examinations are low-molecular-weight chelates of the paramagnetic rare earth metal Gadolinium (Gd). These agents are highly water soluble and rapidly equilibrate with the extracellular fluid compartment, except in the central nervous system, where the blood brain barrier limits permeability. The chelator can be charged or uncharged, linear and flexible, or planar and rigid. Gd chelates are excreted by the kidneys but otherwise exhibit no tissue or organ selectivity. Their safety profile is excellent, especially compared with the iodinated contrast materials used in CT and conventional angiography. Allergic reactions are quite rare, and only a single published report of Gd chelate associated nephrotoxicity exists.
Gd-containing contrast agents increase the signal intensity of perfused tissues on T1-weighted images. The kinetics of contrast enhancement are complex and reflect tissue perfusion, vascular permeability, and the interstitial volume fraction of the tissue. Although tissue enhancement may appear similar on MR imaging and CT, the mechanism of enhancement is different. Gd chelates interact with extracellular water to shorten the T1 of the nearby water protons. The Gd itself produces no MR signal. Thus, Gd acts indirectly. The iodine in iodinated contrast media directly attenuates x-rays. Gd chelates are more sensitive than iodinated contrast media, producing tissue enhancement at lower concentrations. A mass that does not enhance on CT may well enhance on MR imaging, which may lead to errors in lesion characterization. Caution is advised when extrapolating to MR imaging the lessons learned from CT.
Novel MR contrast agents are undergoing clinical testing in the United States and abroad. Among these are blood pool agents, which have potential application in thoracic MR angiography. Blood pool agents include large macromolecular polygadolinium complexes, small hydrophobic Gd chelates that bind to serum albumin, and colloidal iron
P.171
oxide nanoparticles. Unlike ordinary Gd chelates, which rapidly equilibrate with the extracellular space, blood pool agents remain intravascular for long periods. These agents hold promise for improved MR pulmonary and coronary angiography. Colloidal iron oxide also has potential for improving the accuracy of lung cancer staging. This agent is phagocytosed by cells of the reticuloendothelial system. In particular, normal and reactive lymph nodes accumulate colloidal iron oxide, whereas lymph nodes replaced by malignant cells do not. Iron oxide enhanced MR imaging represents an intriguing strategy for distinguishing benign and malignant adenopathy and may play an important role in the future.
Magnetic Resonance Angiography
MR angiography is rapidly becoming a noninvasive alternative to conventional contrast angiography. MR angiography techniques are categorized as black blood and bright blood, depending on the signal intensity of flowing blood. Spin echo is the classic black blood pulse sequence. Spatial saturation bands, cardiac gating in systole, and increased TE (about 20 ms) help suppress signal from flowing blood. Black blood spin echo MR angiography images also depict nonvascular soft tissue structures. Drawbacks to black blood MR angiography include long acquisition times, poor spatial resolution, and difficulty displaying the data as an angiogramlike projection image. Another drawback of black blood MR angiography is that slowly flowing blood may appear bright. This can lead to confusion in distinguishing intraluminal solid tissue, such as thrombus or tumor, from slowly flowing blood. Such confusion may be obviated with a promising new black blood MR angiography technique called double inversion recovery fast spin echo, used with or without cardiac gating.
Bright blood MR angiography techniques include time-of-flight (TOF) MR angiography, phase-contrast (PC) MR angiography, and Gd-enhanced 3D MR angiography. The three techniques use different strategies to make vessels appear brighter than surrounding soft tissues. It is important to understand that most bright blood MR angiography imaging sequences are inadequate for evaluating soft tissue structures; to obtain this information, additional imaging sequences must be appended to the MR imaging examination. TOF and PC MR angiography use flow-related enhancement to increase the signal intensity of flowing blood relative to that of the stationary background tissues. In addition, PC MR angiography develops vessel contrast from velocity-associated phase shifts in flowing blood.
TOF and PC MR angiography are infrequently used in the thorax because they are slow and not especially robust. They are best suited to imaging blood flow that is laminar and of constant velocity. Artifacts arise when blood flow is slow, turbulent, pulsatile, or in plane. Cardiac gating can reduce pulsatility artifact but increases acquisition times. For optimal results, 2D TOF sequences should be prescribed with the imaging slices oriented orthogonal to the direction of blood flow, a requirement that is not easily satisfied in the superior mediastinum. TOF MR angiography uses flow compensation gradients, also called gradient moment nulling, to maintain the phase coherence of flowing blood. In 3D TOF and PC MR angiography, vessels may become saturated as the blood flows within the imaging volume. These and other artifacts may cause signal loss that can simulate vascular disease. The long acquisition times preclude using these 3D MR angiography techniques during suspended respiration. Nonetheless, 2D TOF MR angiography, acquired during repeated breath holding, is useful for evaluating the superior vena cava.
The workhorse of thoracic MR angiography is Gd-enhanced 3D MR angiography, a technique originally developed by Prince and co-workers in 1993. An intravenous bolus of Gd chelate is used to create intravascular high signal on a heavily T1-weighted fast 3D gradient echo sequence. Because flow-related enhancement plays almost no role in developing intravascular contrast, Gd-enhanced 3D MR angiography is more robust than TOF and PC MR angiography. Acquisition times are so short that images can be acquired in a single 15- to 30-second breath-hold. The delay between contrast administration and imaging determines which vascular beds contain contrast agent and appear bright. Several data sets are usually collected to ensure adequate opacification of the desired vascular bed. The arterial-phase MR angiography images are essentially a vascular luminogram, similar to that obtained with conventional angiography. These images do not adequately depict the true outer arterial wall, nor do they adequately depict nonvascular soft tissue structures. Such information is better appreciated on delayed postcontrast images, after contrast has enhanced many soft tissue structures, including the vasa vasorum. The image data from a Gd-enhanced 3D MR angiography study is easily postprocessed and displayed as an angiogramlike maximum-intensity projection (MIP). Limited regions of vascular anatomy or pathology can be displayed with subvolume MIPs. Intriguing new display options include surface rendering and virtual intraluminal endoscopy.
Gd-enhanced 3D MR angiography is widely used to image the thoracic aorta, proximal great vessels, and central pulmonary arteries. In many medical centers, this technique has supplanted conventional contrast angiography and CT for assessing the thoracic aorta in the setting of known or suspected aneurysm or dissection. Although transesophageal echocardiography is more widely available and widely used than MR angiography, transesophageal echocardiography is more invasive and suffers from artifacts and blind spots. However, in the operating room, transesophageal echocardiography will continue to be the imaging modality of choice.
Low-dose Gd-enhanced 3D MR venography represents the conceptual union of conventional contrast venography
P.172
and Gd-enhanced 3D MR angiography. Instead of injecting iodinated contrast material to opacify upper extremity and superior mediastinal veins, a 60-mL intravenous bolus of Gd chelate diluted 1:20 in saline is injected. The 3D MR angiography pulse sequence is acquired during the contrast injection. The Gd chelate must be diluted because commercially available contrast materials are too concentrated and would cause the veins to appear dark rather than bright. This MR venography technique shows promise for evaluating suspected superior vena cava (SVC) syndrome as well as deep venous thrombosis of the subclavian and brachiocephalic veins. The dilute Gd bolus clears after a few minutes and causes little residual intravascular or soft tissue enhancement. Standard, high-dose Gd-enhanced 3D MR angiography can be performed after the low-dose 3D MR venography.
Tissue Characterization
Thoracic imaging is performed to define anatomy or to identify and characterize pathology. High soft tissue contrast makes MR imaging well suited to these tasks. Soft tissues are characterized on MR imaging according to signal intensity on T1- and T2-weighted images and degree of contrast enhancement. Pulsation artifacts and flow voids are helpful for identifying blood vessels with moderate to high flow. Techniques such as fat and water suppression and opposed-phase imaging are used to increase the conspicuity of specific tissues. Normal lung parenchyma and small soft tissue calcifications are poorly depicted on MR imaging. Abnormal lung parenchyma and pulmonary masses are seen on MR imaging but are usually better characterized on CT. Among the MR imaging techniques for detecting larger calcifications, long TE (i.e., T2*-weighted) gradient echo and T2-weighted conventional spin echo sequences are most sensitive, whereas T1-weighted spin echo and all fast spin echo sequences are least sensitive. Normal lung parenchyma has been imaged using a custom-designed, ultrashort (<1 ms) TE, breath-hold, gradient echo pulse sequence; the images, although intriguing, were inferior to high-resolution or conventional CT. Bone appears black on all MR pulse sequences because it contains few mobile protons. However, bone marrow is very well depicted on MR imaging. Despite excellent soft tissue contrast, MR imaging is frequently unable to characterize a mass as benign or malignant, although it may help to narrow the differential diagnosis. Localizing a mass to one of the three mediastinal compartments also helps to limit the differential diagnosis for MR imaging, just as it does for CT and plain radiography.
Tissues that appear bright on T1-weighted images include fat, subacute blood products, and proteinaceous fluid, as well as Gd-enhanced tissues. Fat- or water-suppressed T1-weighted images can help to distinguish unambiguously the macroscopic fat from hemorrhagic or proteinaceous fluid. Opposed-phase gradient echo imaging is sensitive for detecting microscopic fat within a mass lesion such as an adrenal adenoma. On postcontrast T1-weighted images, it is incorrect to assume that all bright tissues have been enhanced. Comparison must be made with the precontrast appearance of the tissue. The rate, pattern, and degree of contrast enhancement are helpful for characterizing a tissue or mass.
Tissues that appear bright on T2-weighted images include fat, water, and many tumors. Water is ubiquitous in the human body. It is responsible for the vast majority of MR signal in nonfatty tissues, organs, masses, and so forth. Not all tissue water exhibits high T2 signal, only free water. This imprecise concept connotes water that is not bound to other substances or surfaces. Certainly, watery fluid within a simple cyst qualifies as free. But intracellular water that is not appreciably bound to subcellular elements or plasma membranes can also be free. For reasons that are largely obscure, tumors often contain large amounts of free water and consequently exhibit higher T2 signal intensity than nonneoplastic tissues. Still, considerable overlap exists in the T2 appearance of neoplastic and nonneoplastic tissues. Inflamed, edematous, and necrotic tissues, for example, may appear bright on T2-weighted images. Granulation tissue may also appear bright on T2-weighted images, but, unlike water, it enhances brightly.
Pathologic conditions can result in visualization of abnormal areas of lung. Newer techniques are emerging that make MR imaging of pulmonary parenchymal disease and pulmonary vascular abnormalities more feasible.
PATIENT COMPATIBILITY
Five to 10% of patients are unable to complete the MR imaging examination because of claustrophobia. Many of these patients are helped by conscious sedation. Some patients are helped simply by a calm and reassuring radiologist or MR technologist. MR imaging is contraindicated in patients with cardiac pacemakers, certain types of metallic brain aneurysm clips, cochlear implants, and several other devices that either do not function or are strongly deflected by the magnetic field in the MR imaging scanner. Continually updated lists of MR-incompatible devices and materials are published.
CLINICAL APPLICATIONS OF THORACIC MAGNETIC RESONANCE IMAGING
Anterior Mediastinum
Thyroid
Substernal thyroid masses are commonly noted as being in the anterior mediastinal compartment, but actually most are located in the pretracheal space behind the innominate
P.173
vessels and thus are in the visceral compartment of the mediastinum (see Chapter 168).
The thyroid can extend caudally from the neck to a substernal location in the superior mediastinum of either the anterior or visceral compartment, the latter being the most common location. Thyroid goiters are the most common masses extending from the neck into the chest. Multiplanar MR imaging can demonstrate the extent of a goiter and its anatomic relationships with the trachea, esophagus, and great vessels. Goiters appear heterogeneous on T1- and T2-weighted images and are usually hypointense to normal thyroid on T1-weighted images. A multinodular appearance may be appreciated. Goiters frequently contain multiple cystic nodules with high T1 signal intensity, an indication that the cysts contain proteinaceous (i.e., colloid cysts) or hemorrhagic fluid. Benign goiters are well encapsulated, whereas thyroid carcinoma may show aggressive spread and regional adenopathy. The T1 and T2 appearance of a thyroid mass is not sufficiently characteristic on MR imaging to distinguish benign from malignant disease. Moreover, MR imaging does not reliably demonstrate calcifications within a thyroid mass, nor does it depict lymphangitic spread of thyroid carcinoma in the lungs.
Parathyroid
Most individuals have four parathyroid glands, arranged as upper and lower pairs at the posterior aspect of the thyroid. Fewer than four parathyroid glands exist in about 10% of the population. Whereas the upper pair of parathyroid glands is usually orthotopic, the lower glands can be ectopic and located virtually anywhere in the mediastinum. The parathyroid glands frequently come to surgical attention because of primary hyperparathyroidism. The four most common causes of primary hyperparathyroidism, in decreasing order of frequency, are parathyroid adenomas (75 to 80%), primary parathyroid hyperplasia (10 to 15%), parathyroid carcinoma (less than 5%), and functioning parathyroid cysts (<1%).
The primary imaging modalities for the parathyroid glands are ultrasound and scintigraphy. Preoperative imaging is infrequent for surgical treatment of primary hyperparathyroidism. Recurrent or persistent hyperparathyroidism after surgical exploration of the neck suggests the presence of ectopic parathyroid tissue. In these patients, MR imaging or scintigraphy can help to locate an ectopic parathyroid adenoma before surgical reexploration. On MR imaging, ectopic parathyroid adenomas most commonly exhibit low T1 signal, high T2 signal, and avid contrast enhancement. This appearance is altered if hemorrhage is present within the adenoma. Imaging should be performed from the thyroid to the base of the heart to cover the potential locations of an ectopic gland. Although its sensitivity is high, MR imaging has two notable limitations: Lymph nodes can simulate ectopic parathyroid adenomas, and parathyroid carcinomas may be indistinguishable from adenomas. In clinical practice, MR imaging is used as a problem-solving tool when scintigraphy is inconclusive or nondiagnostic.
Thymus
The thymus gland is located in the anterior superior mediastinum and is composed of two fused pyramidal lobes. The thymus undergoes marked changes in size and shape between childhood and adulthood but ultimately undergoes fibrofatty involution. In patients younger than 30 years of age, the normal thymus is well depicted on T1-weighted MR images because it is outlined by mediastinal fat, which has higher signal intensity. The contrast between normal thymus and fat decreases with progressive fibrofatty involution. Thymic lesions include cysts, hyperplasia, benign (noninvasive) and malignant (invasive) thymomas, thymic carcinomas, thymic carcinoids, and thymolipomas. The thymus may also harbor lymphoma and germ cell tumors. In thymic hyperplasia, the bipyramidal architecture of the thymus is preserved. Among patients with thymoma, 50% come to clinical attention because of symptoms related to myasthenia gravis; however, only 10% to 15% of patients with myasthenia gravis have thymomas. Invasive, malignant thymoma is the most common primary malignancy of the mediastinum but is much less common than metastatic disease to the mediastinum. Compared with normal thymus, thymomas demonstrate lower T1 and higher T2 signal intensity. Thymomas also disrupt the normal pyramidal thymic morphology and appear as round or multilobulated masses. The diagnosis of invasive thymoma depends on aggressive imaging features, such as gross capsular invasion, mediastinal extension, vascular encasement, regional adenopathy, and pleural metastases. Benign and invasive thymomas are not reliably distinguished on T1- and T2-weighted MR images alone. The multiplanar imaging capabilities of MR imaging may provide an advantage over CT in accurately depicting extraglandular extension of malignant thymoma. Thymolipomas are benign tumors composed almost entirely of fat. They can grow to a large size and envelop the pericardium. On MR imaging, they exhibit the characteristic high T1 and T2 signal intensity of fat.
Germ Cell Tumors
More than 80% of mediastinal germ cell tumors are benign, with most of these being dermoid cysts and benign teratomas. The malignant teratoma is the most common malignant germ cell tumor. Other, less common germ cell tumors include seminomas and nonseminomatous germ cell tumors (choriocarcinomas, embryonal carcinomas, and endodermal sinus tumors). On MR imaging, T1 and T2 signal heterogeneity in an anterior mediastinal mass suggests the diagnosis of germ cell tumor. The high soft tissue contrast of MR imaging helps to identify specific components, such as cysts and fat, which are characteristic of dermoid cysts and teratomas. MR imaging techniques, such as fat and
P.174
water suppression and opposed-phase imaging, may help to characterize unambiguously the microscopic or macroscopic fat within a lesion. MR imaging is also effective at characterizing cystic lesions. Simple fluid in a cyst exhibits low T1 and high T2 signal intensity, whereas complex, proteinaceous, or hemorrhagic fluid typically exhibits higher T1 and variable, but generally lower, T2 signal intensity. On CT, the high density of hemorrhagic or proteinaceous cysts may cause them to be mistaken for solid tumors. Gd chelate enhanced MR images reliably demonstrate solid components or mural nodules within a complex cystic lesion. MR signal intensity alone does not reliably distinguish benign from malignant teratoma. Aggressive imaging features, such as mediastinal extension, regional adenopathy, and distant metastases, are needed to support a diagnosis of malignant teratoma. Tumoral calcification, often present in dermoid cysts and teratomas, is not reliably seen on MR imaging and is best depicted on noncontrast CT. Multiplanar MR images may help in preoperative planning by defining the vascular relationships of mediastinal germ cell tumors.
Lymphoma
Lymphomas are malignant neoplasms of lymphoid tissue that are classified as either Hodgkin's lymphoma or non-Hodgkin's lymphoma. The preponderance of mediastinal lymphomas are Hodgkin's lymphoma, and a majority of patients with Hodgkin's lymphoma have mediastinal disease. An exception is the posterior mediastinum or paravertebral sulcus, where lymphomatous involvement almost always represents non-Hodgkin's lymphoma. CT is the primary imaging modality for the staging and surveillance of lymphoma. However, on CT, the morphology of individual benign and malignant lymph nodes is usually indistinguishable. Massive, confluent lymphadenopathy should suggest the diagnosis of lymphoma. Serial CT examinations are used to follow regression or progression of disease as determined by changes in the size of the nodal mass. Although this approach is adequate for many patients, it has pitfalls. The chief problem is assessing disease status in the residual mediastinal mass after initiation or completion of therapy. A residual mass may contain fibrotic tissue, but no viable tumor, whereupon it is called sterilized lymphoma. Alternatively, a residual mass may contain islands or larger amounts of viable tumor. CT cannot distinguish between viable tumor and sterilized lymphoma in a residual mass that initially shows a decrease in size. Treatment failures are not detected on CT until the residual mass enlarges, thus delaying further therapy.
MR imaging shows promise in evaluating residual mediastinal masses after chemotherapy or radiation therapy for lymphoma. As for CT, MR evaluation of the residual mass should include an assessment of interval size change. In addition, however, several MR signal intensity patterns have predictive value for disease activity. Viable tumor contains moderate amounts of intracellular water and appears bright on T2-weighted images. In contrast, the fibrotic tissue in sterilized lymphoma contains little water and appears dark on both T1- and T2-weighted images. This simple scheme is complicated by radiation-induced inflammation and tumor necrosis, two conditions that produce high T2 signal and can be mistaken for viable tumor in the residual mass, especially during the first 6 months after therapy. If surrounding fat, which exhibits high T1 and T2 signal, is drawn into the fibrotic sterilized lymphoma, the residual mass may exhibit a complex MR appearance. However, careful comparison of the T1- and T2-weighted images often reveals whether fat or tumor is the cause of the high T2 signal. The same information can be obtained more simply with fat-suppressed T2-weighted images. In summary, low T2 signal in a shrinking residual mass indicates a good response to therapy, whereas high T2 signal more than 6 months after therapy suggests tumor recurrence. Besides T2 signal intensity, the degree of Gd contrast enhancement may also predict disease activity in a residual mass. In more recent studies, low and decreasing levels of enhancement on serial MR studies correlated with a good response to therapy, whereas high and increasing levels of enhancement correlated with tumor recurrence. The relative merits of assessing disease activity with T2 signal intensity or contrast enhancement remains to be determined. Radionuclide imaging with gallium 67 (67Ga) has also demonstrated value in detecting recurrent disease. The role of positron emission tomography (PET) is also being evaluated.
MR imaging and MR angiography are well suited to evaluating the relationship of mediastinal lymphoma to airways and vascular structures. Low-dose Gd-enhanced 3D MR venography offers a fast and noninvasive method for assessing superior mediastinal veins. Compression and thrombosis of deep veins, as well as collateral venous drainage, are readily depicted. The relative merits of this technique versus conventional contrast venography and duplex ultrasound remain to be determined. The multiplanar imaging capabilities of MR imaging can help demonstrate lymphomatous involvement of the chest wall, pleura, and pericardium. However, CT is superior for assessing lymphomatous involvement of the lung.
Middle Visceral Compartment
The visceral mediastinal compartment contains blood vessels, lymph nodes and lymphatics, the trachea and esophagus, and a variety of neural structures. The two most common pathologies in the middle compartment are lymphadenopathy and vascular lesions. Mediastinal adenopathy is either reactive or neoplastic. MR imaging and CT are comparably sensitive in detecting mediastinal lymph nodes. On MR imaging, bright mediastinal fat increases the conspicuity of lymph nodes, which are of lower signal intensity on T1-weighted images. Higher soft tissue contrast and multiplanar
P.175
imaging capabilities should provide an advantage for MR imaging over CT in identifying lymph nodes and distinguishing them from adjacent vascular structures. Cardiac and respiratory gating should be used routinely to decrease MR artifacts that might otherwise obscure lymph nodes. Because the spatial resolution of MR imaging is inferior to that of CT, MR imaging may incorrectly identify a cluster of small lymph nodes as a single enlarged node. Also, MR imaging is insensitive to nodal calcification. In patients with a contraindication to iodinated contrast agents, MR imaging should be the primary imaging modality for evaluating suspected mediastinal and hilar adenopathy.
Both CT and MR imaging use lymph node enlargement as a surrogate for pathology. Unfortunately, size is an imperfect indicator: Enlarged nodes can be reactive, and small nodes can be malignant. Analysis of T1 and T2 signal intensities does not improve the accuracy of MR imaging because significant overlap exists between benign and malignant nodes. The limitations of CT and MR imaging support the primacy of lymph node sampling in staging lung cancer, although cross-sectional imaging may direct the mediastinoscopist to specific enlarged lymph nodes. PET scan with fluorodeoxyglucose (FDG) uses increased metabolic activity to identify malignant lymph nodes. The exact role of this imaging modality in staging and monitoring mediastinal and hilar adenopathy is currently under investigation (see Chapter 12).
Paracardiac and Intracardiac Masses
MR imaging is highly efficacious in demonstrating paracardiac and intracardiac masses. The most frequently encountered paracardiac masses are enlarged pericardial fat pads, pericardial cysts, and Morgagni hernias. Atrial myxoma is the most common primary intracardiac mass (50%) but occurs much less frequently than intracardiac mural thrombus. Thymolipoma is a rare fat-containing mass that often extends to the heart. Primary paracardiac and intracardiac malignancies are rare. Mediastinal lesions such as teratoma and lymphoma may extend to a paracardiac location. Similarly, bronchial carcinomas may involve the pericardium by direct extension or through malignant adenopathy. Malignant neoplasms can also metastasize to paracardiac and intracardiac sites.
Conventional ECG-gated T1-weighted spin echo images delineate the cardiac chambers, myocardium, epicardial fat, pericardium, and paracardiac fat and permit precise anatomic localization of mass lesions. T1- and T2-weighted MR images can define specific tissue characteristics, such as fat, hemorrhage, and cystic spaces. Cine MR imaging scans can demonstrate the movement of a mass relative to the heart, providing information about the site of attachment. Cine MR imaging may help differentiate a mobile mass such as atrial myxoma from a fixed mass such as mural thrombus. Cine images can also demonstrate compromised valve function. Post-Gd images are useful in differentiating solid vascular masses from avascular masses such as thrombus. Although echocardiography is usually the primary imaging modality for paracardiac masses, MR imaging may better define the location, origin, and extent of such masses. Similar to other imaging modalities, however, MR imaging frequently fails to provide a specific tissue diagnosis.
Mediastinal Cysts
Benign cystic lesions in the mediastinum can be congenital or acquired. They include bronchogenic cysts, pericardial cysts, neurenteric cysts, meningoceles, esophageal duplication cysts, thymic cysts, cystic hygromas, colloid cysts related to thyroid goiter, pancreatic pseudocysts, abscesses, and hematomas. Specific diagnosis requires careful evaluation of anatomic relationships and convincing evidence that the mass is cystic. Cystic mediastinal masses are often first identified on chest radiography, although their exact nature may be unknown. Noncontrast CT helps define the anatomic relationships of a cystic mass in the axial plane. Both precontrast and postcontrast CT studies are required to prove that a mass is cystic and does not enhance. CT findings can be equivocal when the cyst contents are hyperdense on precontrast images.
MR imaging is used primarily as a problem-solving tool when the CT is equivocal. However, in patients with a contraindication to iodinated contrast material, MR imaging should be the primary imaging modality. Multiplanar MR images superbly depict the anatomic relationships of a cystic mediastinal mass. This information helps narrow the differential diagnosis. T1- and T2-weighted images confirm the cystic nature of most lesions and also characterize the cyst contents. For problematic complex cysts, Gd-enhanced MR imaging, sometimes in several imaging planes, can be used to exclude the presence of solid enhancing tissue within a cyst, a feature that portends malignancy. However, even simple benign cysts often demonstrate a thin, smooth rim of enhancement within the cyst wall. Bronchogenic cysts are either intrapulmonary or mediastinal, with the latter being more common. Mediastinal bronchogenic cysts are generally located near the carina but do not communicate with the bronchial tree. They are usually asymptomatic unless they compress critical adjacent structures such as airways or blood vessels. The cyst contents can vary from serous to proteinaceous and may contain blood products from prior hemorrhage. Serous fluid exhibits low T1 signal, whereas hemorrhagic, proteinaceous, or mucinous fluid exhibits intermediate to high T1 signal (Fig. 11-2). Enteric duplication cysts are usually posterior lesions that abut the esophagus or reside within the esophageal wall. Location provides the key to the correct diagnosis. Neurenteric cysts and meningocele are also paraspinal posterior mediastinal lesions. Their diagnosis is suggested by associated vertebral anomalies. The cerebrospinal fluid in a meningocele appears similar to pure water on MR imaging, exhibiting low T1 and high T2 signal intensity.
 |
Fig. 11-2. Bronchogenic cyst. Axial, electrocardiogram-gated, T1-weighted spin echo (A) and T2-weighted fast spin echo (B) MR images demonstrate a smooth, well-marginated cystic mass (c) in the right paratracheal space. The contents of the mass did not enhance (not shown). |
P.176
Posterior Compartment: Paravertebral Space
The abundance of paravertebral neural tissue explains the high frequency of neurogenic tumors in the paravertebral spaces. These tumors are classified according to the nerve of origin: neurofibromas, schwannomas, and malignant peripheral nerve sheath tumors from peripheral nerves; ganglioneuromas, neuroblastomas, and ganglioneuroblastomas from sympathetic nerves; and paragangliomas and pheochromocytomas from neuroectodermal cells closely associated with autonomic nerves. Other paravertebral masses include paraspinal abscesses, commonly related to tuberculosis; lymphoma, usually non-Hodgkin's lymphoma; extramedullary hematopoiesis; and primary and metastatic vertebral body neoplasms.
Neurofibromas can be intradural, extradural, or both, in which case they often assume a dumbbell shape and expand the neural foramina. Multiplanar MR imaging delineates the extent of tumor and depicts compression of adjacent soft tissue structures. CT is superior to MR imaging at depicting bony erosions. On MR imaging, nerve sheath tumors exhibit low to intermediate T1 signal, high T2 signal, and marked contrast enhancement. MR imaging does not reliably distinguish benign from malignant tumors. Imaging features that usually connote a benign etiology, such as well-defined borders, are not helpful: Plexiform neurofibromas have an aggressive, invasive appearance, whereas early peripheral nerve sheath tumors can have a nonaggressive appearance. Of course, regional adenopathy and distant metastases would suggest the malignant nature of an otherwise indeterminate mass.
Lymphoma in the posterior mediastinum can encase the aorta and mimic an aortic dissection or aneurysm. Periaortic lymphoma is further suggested by a mass interposed between the vertebra and aorta as well as adenopathy in other locations. These imaging features, although suggestive, are not diagnostic. Careful evaluation of aortic morphology on precontrast and postcontrast images may provide a clue to the correct diagnosis.
Ten percent of pheochromocytomas are extraadrenal, and 1% are located in the mediastinum, most commonly in the paravertebral sympathetic nerves. Another rare site for this tumor is the pericardium, particularly near the aortopulmonary window (see Chapter 191). Mediastinal pheochromocytomas can be difficult to detect. The primary imaging modality for tumor localization is the iodine 131 (131I)-metaiodobenzylguanidine scan. Although these scans have high sensitivity and specificity, they suffer from low anatomic resolution. MR imaging can be used as an adjunct, providing more precise anatomic localization of lesions identified on 131I-metaiodobenzylguanidine scans. Pheochromocytomas are often highly conspicuous on MR imaging because they exhibit high T2 signal and marked contrast enhancement. However, intratumoral hemorrhage can change the classic MR appearance.
Thoracic Aorta
In many institutions, MR imaging is becoming the modality of choice for evaluating thoracic aortic aneurysm and dissection. The standard MR examination of the thoracic aorta varies considerably according to institutional preferences. At our hospital, the MR imaging consists of an axial ECG-gated T1-weighted spin echo sequence, an axial cine gradient echo sequence, a Gd-enhanced 3D MR angiography, and a postcontrast axial T1-weighted sequence. The spin echo sequence provides black blood MR angiography
P.177
and a survey of thoracic soft tissues. Cine MR imaging helps identify the intimal flap in aortic dissection, presence of flow in the true and false lumina, and aortic valvular insufficiency. Gd-enhanced 3D MR angiography assesses the presence and full extent of aneurysm or dissection and branch vessel involvement. Postcontrast axial images provide a second opportunity to evaluate thoracic soft tissues, identify the true outer wall of an aneurysmal vessel, and reveal active contrast extravasation from a ruptured aneurysm, pseudoaneurysm, or dissection.
The thoracic aorta is an elastic artery composed of an intima, media, and adventitia. The intima is covered with a thin layer of endothelial cells that contact blood flowing in the vessel lumen. The media contains vascular smooth muscle cells and elastin fibers. The adventitia is a layer of loose connective tissue that contains blood vessels (the vasa vasorum) and nerves. The vasa vasorum enhances and is easily identified on delayed postcontrast MR images, allowing accurate identification of the true outer wall. This is particularly helpful when the vessel lumen and true outer wall are separated by atherosclerotic plaque or mural thrombus.
Congenital anomalies of the aorta include variations in the branching of the great vessels. These anomalies are frequently asymptomatic and discovered incidentally on imaging studies. A common variant is a two-vessel aortic arch with a common trunk supplying the brachiocephalic and left common carotid arteries (bovine arch). Another common variant is a left vertebral artery, which takes origin directly from the aortic arch at a site between the origins of the left common carotid and left subclavian arteries (Fig. 11-3). Less common is an aberrant right subclavian artery with a left aortic arch. In this variant, four vessels originate from the aortic arch. The aberrant right subclavian artery arises from the aorta distal to the left subclavian artery. The aberrant vessel can originate directly from the aorta or from an outpouching called the diverticulum of Kommerell. Rarely, the diverticulum becomes aneurysmal (Fig. 11-4). The aberrant right subclavian artery courses obliquely behind the esophagus from inferior left to superior right and leaves a characteristic impression on the esophagus on a barium esophagogram. An aberrant left subclavian artery with a right aortic arch is a much less common variant, but it is the most likely arch anatomy in an asymptomatic patient with a right aortic arch. This variant is infrequently associated with congenital heart disease. In contrast, congenital heart disease is present in most patients with a right aortic arch and mirror-image branching. Conventional ECG-gated spin echo MR images, often acquired in several imaging planes, can identify and characterize congenital vascular anomalies in the thorax. Gd-enhanced 3D MR angiography with multiplanar reformations and subvolume MIP is particularly helpful in depicting the origins and courses of branch vessels. Conventional angiography may fail to delineate branch vessels adequately because only a limited number of projections are obtained.
 |
Fig. 11-3. Variant aortic arch anatomy. Oblique sagittal maximum intensity projection image from a gadolinium-enhanced three-dimensional magnetic resonance angiography study shows the left vertebral artery arising directly from the aortic arch (arrow) between the left common carotid and left subclavian arteries. Artifact anterior to the ascending aorta (arrowheads) is caused by metallic surgical clips from prior repair of a type A aortic dissection. |
Coarctation and Aortic Dissection
Although MR imaging is useful in evaluation of aortic coarctation and is ideally suited to evaluate suspected aortic dissection, these subjects are not germane to this text. The reader is referred to the Reading References for this chapter.
Aortic Aneurysm
An aneurysm can be defined as an inappropriate dilation of an artery. Atherosclerosis is the most common cause. Aneurysms can be classified according to morphology as fusiform or saccular. Fusiform aneurysms encompass the entire circumference of the vessel wall and exhibit a spindle
P.178
shape. Saccular aneurysms involve only a portion of the vessel wall and manifest as an eccentric outpouching (Fig. 11-5). Aneurysms are classified as true if all three layers of the vessel, intima, media, and adventitia, are intact, or as false or pseudoaneurysm if disruption of one or more layers occurs. Alternatively, a false aneurysm can be considered as a contained rupture.
 |
Fig. 11-4. Aberrant right subclavian artery with aneurysm of diverticulum of Kommerell. Axial, electrocardiogram-gated, T1-weighted spin echo MR image (A) demonstrates a rounded mediastinal mass (arrows) contiguous with the distal aortic arch. Intermediate T1 signal intensity within the mass could represent slow blood flow, thrombus, or both. An oblique coronal maximum intensity projection image from gadolinium-enhanced 3D MR angiography (B) shows an ABER RT SUBCLAV artery arising from a diverticulum of Kommerell; the aneurysm is not appreciated. A sagittal reformatted image from the same 3D MR angiography, but acquired 1 minute later (C), shows that the mediastinal mass is actually an aneurysm with extensive mural thrombus (arrowheads). Whereas the arterial phase MR angiography image (B) depicts only the vascular lumen, similar to conventional contrast angiography, the delayed postcontrast MR angiography image (C) also depicts the wall of the aneurysm, thereby improving assessment of mural thrombus and residual lumen (L). ASC AO, ascending aorta; DESC AO, descending aorta; SVC, superior vena cava. |
The first steps in evaluating and managing an aneurysm are to define its location and extent. Knowing the rate of growth of an aneurysm is also important but requires previous imaging studies. Thoracic aneurysms can involve the ascending aorta, aortic arch, or descending aorta. The latter may extend below the diaphragm. Ascending aortic aneurysms that involve the aortic root may cause valvular dysfunction, most commonly aortic insufficiency. MR imaging is ideally suited to showing the anatomic relationships of an aneurysm with respect to vascular and nonvascular structures in the thorax. Large thoracic aortic aneurysms can become symptomatic from congestive heart failure caused by aortic insufficiency, from compression of
P.179
the trachea or esophagus, from hoarseness caused by compression of the recurrent laryngeal nerve, or from erosion of bony structure bodies with subsequent pain.
 |
Fig. 11-5. Saccular aneurysms. Oblique sagittal maximum-intensity projection image from a gadolinium-enhanced 3D MR angiography study shows one small and two large saccular aneurysms of the proximal descending thoracic aorta. The distal descending aorta was not included in the volume used to create the maximum-intensity projection image. |
Trauma can result in aortic transection or disruption. Traumatic injuries to the aorta are rapidly fatal, with most victims dying at the scene of injury. In a review of 275 cases of nonpenetrating aortic trauma, 87% of patients died within the first hour. Posttraumatic aneurysms of the thoracic aorta are distinctive by their locations. The two most common sites are the proximal ascending aorta and the aortic isthmus, the site of insertion of the ligamentum arteriosum. These sites of maximal aortic fixation are believed to be most susceptible to mechanical injury, especially deceleration injury. Among patients who survive traumatic aortic injury and reach medical care, about 95% have an injury of the aortic isthmus. Undiagnosed and untreated traumatic aortic injuries can result in a chronic aneurysm or pseudoaneurysm. These pseudoaneurysms generally have a saccular appearance and occur in a younger age group than do atherosclerotic aneurysms. The accepted standard for evaluating patients with suspected traumatic aortic injury is contrast angiography. Multiple projections may be required to identify subtle aortic lacerations. The angiography suite is an excellent site for closely monitoring potentially unstable trauma patients. Trauma patients often undergo helical CT examinations because of concomitant injuries. The experience with MR imaging in traumatic aortic injury is limited. Current experience suggests that normal MR imaging does not completely exclude traumatic aortic injury, especially when the clinical suspicion is high. MR imaging and CT can identify blood in the mediastinal fat around the site of an aortic laceration, and the absence of such blood decreases the likelihood of traumatic aortic injury. In chronic traumatic aortic aneurysms, MR imaging can be used for follow-up and to determine the need for surgical intervention. Further studies are needed to define the role of MR imaging in the evaluation of these patients.
Accurate and reproducible measurement of an aneurysm is important for several reasons. The natural history of untreated thoracic aneurysms is progressive enlargement with increasing risk for rupture and death. In a series of 107 patients, the 5-year survival rate for untreated thoracic aortic aneurysms was 50%. Deaths were attributable to aneurysm rupture in 32%. Surgical intervention is based, in part, on the size and location of an aneurysm and on its rate of enlargement. Transaxial images, such as those obtained with conventional CT, may overestimate the diameter of an aneurysm that courses obliquely through the imaging plane. Aortic tortuosity also can complicate accurate measurement of an aneurysm on contrast angiography. Ideally, measurements should be made in a plane perpendicular to the long axis of the aneurysm. 3D reformations of MR imaging or CT data are helpful in this regard (Fig. 11-6). The presence
P.180
of mural thrombus within an aneurysm leads to two different measurements: one for the diameter of the patent lumen and a second for the true wall-to-wall diameter. Imaging modalities such as contrast angiography and arterial-phase Gd-enhanced 3D MR angiography depict only the lumen of the aneurysm. In contrast, CT, MR imaging, and ultrasound depict the entire aneurysm, including the mural thrombus. Caution is warranted when comparing aneurysm measurements derived from different imaging modalities.
 |
Fig. 11-6. Ascending aortic aneurysm in Marfan's disease. Oblique coronal maximum-intensity projection image from gadolinium-enhanced 3D MR angiography shows aneurysmal dilatation of the ascending aorta that is most pronounced at the aortic sinus, giving the characteristic tulip bulb appearance. Vessel diameters were measured at four levels (from proximal to distal): aortic root, aortic sinus, sinotubular junction, and midascending aorta. This patient had aortic insufficiency (not shown), most likely from a dilated aortic root. |
Atherosclerosis is by far the most common cause of thoracic aortic aneurysms. Atherosclerotic aneurysms are more common in men than in women and increase in frequency after the fourth decade of life. Within the thorax, most atherosclerotic aneurysms are found in the descending aorta. Atherosclerosis is also the most common cause of aneurysms in the ascending aorta and aortic arch. However, an isolated aneurysm of the ascending aorta, especially in a younger patient, should prompt a search for another etiology, such as Marfan's syndrome (see Fig. 11-6) or a bicuspid aortic valve. Tertiary syphilis also can produce an isolated ascending aortic aneurysm (luetic aneurysm).
 |
Fig. 11-7. Ruptured aortic aneurysm. Axial, electrocardiogram-gated, T1-weighted spin echo MR image (A) shows mediastinal hemorrhage adjacent to the aortic arch and a large hemorrhagic left pleural effusion. Oblique sagittal maximum-intensity projection image from a gadolinium-enhanced 3D MR angiography (B) demonstrates a saccular aneurysm (arrow) of the proximal descending aorta. Axial postcontrast gradient-echo image (C) shows the aneurysm as a subtle luminal protrusion arising from the posterolateral aspect of the distal arch (arrow); at surgery, this was thought to represent the site of rupture. |
Aortic pseudoaneurysms can form secondary to penetrating trauma, as a surgical complication, or as a complication of an untreated aneurysm (Fig. 11-7). Common locations for postoperative aortic pseudoaneurysms include the cannulation site, the aortotomy site, and the graft suture line. Acute and subacute pseudoaneurysms are generally considered a surgical emergency. Their natural history is continued
P.181
enlargement. Pseudoaneurysms become symptomatic as a result of compression of adjacent structures. Rupture of a thoracic aortic pseudoaneurysm is generally fatal. Conventional angiography is the standard for imaging pseudoaneurysms. However, the arguments for using MR imaging and MR angiography are quite persuasive. Gd-enhanced 3D MR angiography with multiplanar reformations and subvolume MIP images can depict the presence, location, and neck of a pseudoaneurysm, features that might otherwise be obscured by overlapping vessels on conventional angiography. Spin echo and delayed postcontrast MR images can detect thrombus within a pseudoaneurysm, complications related to a leaking pseudoaneurysm, and compression of adjacent anatomic structures. In the future, MR imaging will likely play a greater role in preoperative planning of pseudoaneurysm repair.
For patients unable to tolerate surgical repair of thoracic and abdominal aortic aneurysms, covered endovascular stent grafts now offer a nonsurgical alternative. Stent grafts are custom designed for each patient. To determine whether a patient is a candidate for stent graft therapy, the aneurysm must be evaluated for size, shape, location, and relationship to branch vessels. Most of the early evaluations have been performed using helical CT and CT angiography. Multiplanar reformations are important for making highly accurate measurements of the aneurysm and the lengths of the proximal and distal aneurysm necks. Measurements based solely on transaxial images may be inaccurate because of foreshortening. MR imaging and Gd-enhanced 3D MR angiography in particular offer an alternative to CT. In fact, MR may be the only suitable imaging modality for patients with impaired renal function or allergies to iodinated contrast media. Many commercially available stent grafts are constructed with Nitinol support struts, which, unlike most metals, produce little MR artifact. MR imaging can also be used to evaluate patients for complications of stent graft placement such as endoleak. Studies are underway to assess the utility of MR imaging for thoracic aortic stent grafts.
PULMONARY VASCULATURE
MR imaging offers a noninvasive method for imaging the pulmonary vasculature (Figs. 11-8 and 11-9). The precise role of MR imaging versus other image modalities remains to be established and certainly depends on the clinical circumstances. Conventional pulmonary angiography remains the standard, but research efforts have been aimed at identifying alternative modalities that are less invasive and do not expose patients to iodinated contrast materials. Radionuclide imaging of pulmonary ventilation and perfusion is widely used but suffers from limited specificity and anatomic localization. Contrast-enhanced helical CT shows promise for evaluating pulmonary vessels but, like MR imaging, its accuracy and ultimate clinical role remain to be determined.
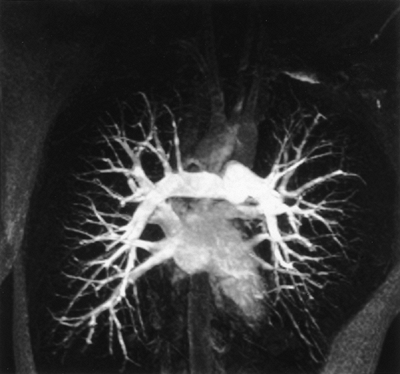 |
Fig. 11-8. Normal pulmonary MR angiogram. Oblique coronal maximum-intensity projection image from gadolinium-enhanced 3D MR angiography shows central, lobar, and segmental pulmonary arteries and overlapping pulmonary veins. The MR angiography was acquired during a single 25-second breath hold. The intravenous contrast bolus has not yet opacified the aorta. |
Pulmonary Hypertension
Pulmonary hypertension connotes abnormal increased pulmonary arterial pressure and increased pulmonary vascular resistance. The most common causes of pulmonary hypertension are recurrent pulmonary emboli, chronic lung diseases that increase pulmonary vascular resistance, and congenital or acquired heart diseases that increase pulmonary blood flow or vascular resistance (Fig. 11-10). Pulmonary hypertension is called primary or idiopathic when all
P.182
known etiologies have been excluded. The risks associated with conventional pulmonary angiography increase in patients with elevated pulmonary artery and right-sided heart pressures.
 |
Fig. 11-9. Anastomotic stricture of main pulmonary artery. Axial maximum-intensity projection image from gadolinium-enhanced 3D MR angiography shows moderate focal narrowing of the main pulmonary artery anastomosis (arrow). MR angiography was ordered to evaluate low blood oxygen saturation in a patient who recently underwent heart transplantation. MPA, mean pulmonary artery. |
 |
Fig. 11-10. Severe pulmonary hypertension in surgically treated pentalogy of Fallot with right aortic arch. Oblique coronal reformatted images from gadolinium-enhanced 3D MR angiography show a widely patent Potts' shunt from the right descending aorta to a massively dilated right pulmonary artery (A) and a patent Blalock-Taussig shunt constructed from the left subclavian artery to a less severely dilated left pulmonary artery (B). The MR angiogram was obtained to evaluate the pulmonary circulation before right lung transplantation. |
Anatomic changes associated with pulmonary hypertension include dilated central pulmonary arteries, tapered or pruned peripheral pulmonary arteries, right ventricular hypertrophy, and reverse curvature of the interventricular septum. The size of the central pulmonary arteries correlates with the degree of pulmonary hypertension, although the correlation is imperfect. Mild pulmonary hypertension may produce no enlargement of the central pulmonary vessels. Conversely, central pulmonary arteries may be enlarged without concomitant pulmonary hypertension, such as occurs in poststenotic dilatation from pulmonary valvular stenosis.
Both MR imaging and CT are more accurate than plain chest radiography in assessing pulmonary artery size. ECG-gated T1-weighted MR spin echo or double-inversion recovery fast spin echo images in the axial plane usually provide adequate black blood images for measuring the central pulmonary arteries. Alternatively, bright blood cine gradient echo or Gd-enhanced 3D MR angiography images can be used.
The severity of pulmonary hypertension has been correlated with increased intraluminal signal intensity in the pulmonary arteries on spin echo images. Signal-intensity changes are most pronounced during systole and early diastole when, in normal patients, high flow velocities usually produce a signal void. Slow blood flow during late diastole leads to increased intraluminal signal intensity in both normal subjects and patients with pulmonary hypertension.
Pulmonary Embolism
Acute pulmonary embolism (PE) is a common but frequently undiagnosed and potentially life-threatening disorder. Two thirds of patients with suspected PE prove to have another diagnosis. The etiology of PE is usually deep vein thrombosis (DVT), most commonly from the lower extremities. However, the frequent use of central venous catheters has increased the incidence of upper extremity DVT. The diagnostic workup of PE should include a search for DVT. Conceptually, PE and DVT should be considered two components of the same disorder, namely venous thromboembolic disease.
Chronic PE represents an uncommon complication of acute PE. Acute emboli become organized and incorporated into the pulmonary arterial wall, essentially forming mural thromboemboli. Patients with chronic PE often develop progressive pulmonary hypertension. Chronic PE can be treated with thromboendarterectomy if the thromboemboli are centrally located. However, centrally located mural thrombus may be difficult to detect on conventional pulmonary angiography because the resulting luminal narrowing may be subtle. Cross-sectional imaging techniques, such as MR imaging and CT, can visualize both the luminal narrowing and the mural thickening, thus increasing the conspicuity of central thromboemboli (Fig. 11-11). In selected presurgical patients with central thromboemboli, cross-sectional imaging may obviate the need for conventional pulmonary angiography.
 |
Fig. 11-11. Central pulmonary artery thrombosis. Coronal maximum-intensity projection image from gadolinium-enhanced three-dimensional magnetic resonance angiography (A) shows marked dilation of the main and left pulmonary artery from long-standing pulmonary hypertension. The right pulmonary artery is narrowed (arrow). A magnified SAG maximum-intensity projection image (B) demonstrates a thick rind of mural thrombus (arrowheads) causing severe narrowing of right pulmonary artery (RT PA) lumen (curved arrow). |
P.183
Disagreement exists concerning the optimal imaging strategy for suspected acute PE (see also Chapter 10). The choices include conventional pulmonary angiography, radionuclide ventilation-perfusion ([V with dot above]/[Q with dot above]) lung scan, CT, and MR imaging. The standard is conventional pulmonary angiography, yet this modality is underused because clinicians perceive, incorrectly, that it is risky. The [V with dot above]/[Q with dot above] lung scan is commonly the first imaging examination after a chest radiograph in patients with suspected acute PE. A normal or low-probability [V with dot above]/[Q with dot above] scan and a low clinical suspicion effectively exclude PE. Conversely, a high-probability [V with dot above]/[Q with dot above] scan and a high clinical suspicion are sufficient to establish a diagnosis of PE and begin treatment; no further imaging studies are required. The weakness of the [V with dot above]/[Q with dot above] scan relates to the large number of intermediate-probability (i.e., indeterminate) results, a situation that occurs in most patients with lung consolidation on their chest radiograph. Also, a low-probability [V with dot above]/[Q with dot above] scan, coupled with a high clinical suspicion, does not exclude acute PE. Unfortunately, many patients with an inconclusive [V with dot above]/[Q with dot above] scan, who should undergo pulmonary angiography and a search for DVT, receive no further imaging. The clinical criteria for diagnosing acute PE are notoriously unreliable, and anticoagulation therapy carries a nontrivial morbidity. Outcome studies
P.184
suggest that it may be possible to forego pulmonary angiography and anticoagulation therapy in a subset of patients with intermediate-probability [V with dot above]/[Q with dot above] scans who have normal cardiopulmonary reserve and no evidence of DVT.
The role of MR imaging and CT in evaluating suspected acute PE has yet to be established. Pulmonary vasculature imaging presents a formidable technical challenge for both modalities, but especially for MR imaging. Central pulmonary vessels are affected by cardiac and respiratory motions and pulsatile blood flow. For MR imaging, peripheral pulmonary vessels are affected by susceptibility artifact from air-filled lung. Advances in MR hardware and software have led to improved image quality. Cardiac and respiratory gating and spatial presaturation pulses are mandatory for nonbreath-hold black blood imaging sequences, such as T1-weighted spin echo. Double-inversion recovery fast spin echo is a newer pulse sequence that can be acquired during suspended respiration and that appears to produce more robust black blood MR angiography images, even without ECG gating. However, the relatively long minimum TE used in these pulse sequences exacerbates susceptibility-related signal loss in peripheral vessels. Therefore, only central pulmonary vessels are reliably evaluated by these techniques. Emboli appear as foci of increased intraluminal signal on spin echo images. Acute emboli, which likely contain methemoglobin, exhibit high T1 signal, whereas chronic emboli exhibit lower T1 signal. The conspicuity of emboli on spin echo images depends on differences between the high signal intensity of emboli and the low signal intensity of flowing blood. Slow pulmonary blood flow, which is characteristic of chronic pulmonary hypertension, decreases the conspicuity of central PE. Thus, the diagnosis of central PE can be excluded only if the pulmonary arteries appear entirely normal on black blood MR images. If intraluminal signal is present, the black blood MR angiography sequence should be considered inconclusive.
Cine gradient echo MR imaging is a bright blood technique that does not require exogenous contrast material. It is useful for distinguishing between slow blood flow and solid intraluminal masses such as emboli. On this imaging sequence, emboli appear as low signal foci surrounded by the higher signal of flowing blood. Cine MR imaging with spatial modulation of magnetization tagging increases the conspicuity of immobile structures within blood vessels, such as the mural thrombus associated with chronic PE. However, susceptibility artifact and turbulent blood flow can introduce signal artifacts that simulate embolic disease on gradient echo images. Also, long image acquisition times impose a practical limit on the anatomic coverage achievable with standard cine MR imaging. Newer ultrafast cine gradient echo pulse sequences, which use a segmented k-space acquisition, permit greater anatomic coverage during a period of several breath-holds. Although its exact role has yet to be determined, cine MR imaging is probably best used as a problem-solving technique for inconclusive spin echo images of central pulmonary arteries in patients with suspected central thromboembolic disease.
Gd-enhanced 3D MR angiography is one of the most important techniques in MR imaging of the pulmonary vasculature. The entirety of both lungs and the mediastinum can now be imaged with 3- to 4-mm spatial resolution during a single 25- to 30-second breath-hold on a state-of-the-art MR scanner. Postprocessing the MR angiography image data using multiplanar reformations and subvolume MIP helps to identify emboli that might otherwise be obscured by overlapping vessels. Efforts are underway to create image-processing software that separates pulmonary arteries and veins. Gd-enhanced 3D MR angiography does have several drawbacks: (a) the state-of-the-art hardware and software that are desirable for 3D MR angiography are not widely available, (b) the duration of the breath-hold may prove excessive for severely tachypneic or dyspneic patients, and (c) the spatial resolution of MR imaging and CT is inferior to that of conventional pulmonary angiography. To achieve a high degree of pulmonary vascular enhancement with extracellular Gd chelates, the time delay between contrast injection and MR imaging must be chosen carefully. Intravascular MR contrast agents, which remain in the intravascular compartment for hours, should obviate the need for precise timing. These expectations have proved correct in preliminary studies with several different intravascular MR contrast agents.
MR imaging and CT have demonstrated high sensitivity for detecting emboli in central and segmental pulmonary arteries; however, both modalities fall short of conventional pulmonary angiography in detecting subsegmental emboli. Questions remain about the clinical significance of subsegmental emboli in patients without evidence of DVT. Clinical outcome studies are needed to resolve these questions. MR imaging and CT offer an advantage over pulmonary angiography and [V with dot above]/[Q with dot above] lung scans: one-stop shopping. In patients with suspected acute PE, MR imaging and CT examinations can be easily augmented to include a search for DVT. Studies have shown that MR venography in particular has a high sensitivity and specificity for detection of DVT in the pelvis and lower extremities. Another advantage of MR imaging and CT is that they can identify many nonembolic causes of symptoms that mimic those of acute PE.
MR perfusion imaging is a new technique for evaluating blood flow in the lung. It is conceptually similar to a radionuclide perfusion scan but with higher spatial resolution and better anatomic localization. The goal of MR perfusion imaging is to identify regions of pulmonary parenchyma with decreased or absent perfusion. Although no attempt is made to image the pulmonary arteries
P.185
directly or identify individual thromboemboli on these scans, the technique can supplement a pulmonary MR angiography study. It is assumed that peripheral wedge-shaped perfusion defects are caused by embolic narrowing or occlusion of the feeding artery. Pulmonary perfusion imaging is, in general, more sensitive than angiographic imaging for detecting peripheral emboli because the perfusion defect resulting from a subsegmental embolus is much larger than the embolus itself. Currently, two basic categories of MR pulmonary perfusion imaging exist. One version uses an intravenous bolus of Gd chelate to opacify the pulmonary parenchyma; the other uses arterial spin tagging. Subtraction images (postcontrast/tagged, precontrast/tagged) are used to increase the conspicuity of pulmonary perfusion abnormalities.
Pulmonary Arteriovenous Malformations
On chest radiography, pulmonary arteriovenous malformations (AVMs) are distinguished by their predilection for the periphery of the lower lobes and their large feeding arteries and draining veins. Multiple pulmonary AVMs are seen in one third of patients and in association with hereditary hemorrhagic telangiectasia (Osler-Weber-Rendu disease). More than one feeding artery is present in 20% of patients. The experience with MR imaging of pulmonary AVM is limited but promising. The key imaging sequence is Gd-enhanced 3D MR angiography. Multiplanar reformations and MIP reconstructions of 3D MR angiography data can demonstrate the enhancing nidus of the AVM as well as the course and size of all feeding and draining vessels (Fig. 11-12). This information can be used to help plan surgical repair or percutaneous embolization of the feeding vessels (see Chapter 82).
Pulmonary Sequestrations
Pulmonary sequestrations are rare congenital malformations of lung that have no communication with the tracheobronchial tree. Two types occur: intralobar and extralobar. Intralobar sequestrations are surrounded by the visceral pleura, whereas extralobar sequestrations are surrounded by their own pleura. Intralobar sequestrations appear as a mass with solid and cystic components and are usually asymptomatic, unless they become infected. The most common location is the posterior segment of the left lower lobe, followed by the right lower lobe. Extralobar sequestrations are located near the left hemidiaphragm in 90% of patients and are sometimes infradiaphragmatic. They are usually asymptomatic. Both types of sequestrations derive their arterial supply from aorta or its branches, most commonly the descending thoracic aorta. The venous drainage of intralobar sequestrations is usually to the left atrium but may be to the right atrium. The venous drainage of extralobar sequestrations is always systemic, most commonly the inferior vena cava or azygous hemiazygous system. Although experience is limited, MR imaging appears to be an excellent modality for depicting sequestrations and their anatomic relationships and for identifying their vascular supply (Fig. 11-13). MR imaging can be useful for planning the surgical resection of a symptomatic sequestration.
 |
Fig. 11-12. Pulmonary AVM. Oblique sagittal maximum-intensity projection image from gadolinium-enhanced 3D MR angiography shows a large, solitary AVM in the right lower lobe. The patient came to medical attention because of a brain abscess, a well-known complication of pulmonary AVM. The feeding artery (closed arrow) and draining vein (open arrow) are well depicted. |
MEDIASTINAL VEINS
MR imaging is an excellent modality for the evaluation of mediastinal veins and can obviate the need for conventional contrast venography of the upper extremities. MR can delineate venous obstructions in the internal jugular, subclavian, and brachiocephalic veins and SVC (Fig. 11-14). Furthermore, MR can usually differentiate intraluminal thrombus or tumor from extrinsic compression. In contrast to conventional venography, MR can fully depict a mass lesion responsible for extrinsic venous compression. Axial 2D TOF MR venography is most useful for evaluating the internal jugular veins and SVC because their course is straight and directed perpendicular to the axial imaging plane. Sagittal 2D TOF MR venography can be used to study
P.186
P.187
P.188
the subclavian veins, but we prefer a more versatile technique called low-dose Gd-enhanced 3D MR venography. This technique is analogous to conventional contrast venography and requires establishing intravenous access in the affected upper extremity or extremities. Image data from 3D MR venography can be postprocessed using multiplanar reformations and MIPs to extract the maximum amount of useful clinical information. Our standard MR venography examination also includes ECG-gated axial T1-weighted spin echo images to evaluate the soft tissue anatomy of the thorax.
 |
Fig. 11-13. Intralobar pulmonary sequestration in a 22-year-old woman with recurrent pulmonary infections. Precontrast (A) and postcontrast (B) axial T1-weighted images show an enhancing solid and cystic mass (arrowheads) in the posterior basal segment of the left lower lobe. Axial T1-weighted image at a level caudal to part A shows a large feeding artery (curved arrow) arising from the aorta (C). Coronal (D) and oblique sagittal (E) maximum-intensity projection images from gadolinium-enhanced 3D MR angiography demonstrate to better advantage the systemic arterial supply arising from the distal thoracic aorta (solid arrow) and left lower lobe pulmonary venous drainage (open arrow). The MR imaging was requested for preoperative planning. |
 |
Fig. 11-14. Central venous thrombosis after left pneumonectomy and radiation therapy for squamous cell carcinoma of lung. Coronal (A) and axial (B) maximum-intensity projection images from a bilateral upper extremity, low-dose gadolinium-enhanced 3D MR venogram demonstrate a tight, focal stenosis of the left brachiocephalic vein (A, arrow) and nonocclusive thrombus in the superior vena cava (B, arrow). Note the wishbone-shaped collateral veins, which permit flow around the stenosis (A, arrowheads). Oblique sagittal maximum-intensity projection image from standard dose gadolinium-enhanced 3D MR angiography obtained during the venous phase (C) shows collateral flow in a prominent azygous vein (thick arrow) and enlarged intercostal veins (arrowheads). Nonocclusive thrombus is seen in the SVC (thin arrows). The thrombus did not enhance and was thought to be bland. MR venography was obtained to evaluate swelling of the left upper extremity and neck. Symptoms improved after balloon angioplasty and stenting of the SVC. |
The demand for thoracic venography is increasing and likely reflects the ever-increasing use of central venous catheters. Vein searches are commonly requested to determine available sites for new central venous catheters. MR venography has been useful for the aforementioned indications as well as for the diagnosis of congenital venous anomalies such as persistent left SVC, anomalous pulmonary venous return (Fig. 11-15) and scimitar syndrome, and interruption of the inferior vena cava with azygos or hemiazygos continuation.
 |
Fig. 11-15. Partial anomalous pulmonary venous return. Coronal (A) and axial (B) maximum-intensity projection images from the venous phase of gadolinium-enhanced 3D MR angiography show a RT ULPV draining into the SVC. This patient also had a sinus venosus type atrial septal defect (not shown). |
BRONCHIAL CARCINOMA
Lung cancer is the leading cause of cancer-related deaths in women and men. Surgical resection offers the only chance for a complete cure. The staging of lung cancer helps determine prognosis and therapeutic options, including suitability for surgery. CT remains the cross-sectional imaging method of choice for staging most patients with lung cancer. CT offers many advantages over MR imaging, including superior imaging of lung parenchyma to detect lymphangitic spread of tumor, higher sensitivity for detection of small (<5 mm) lung nodules, better spatial resolution, lower cost, shorter imaging times, and wide availability. CT can also readily detect calcifications in mediastinal lymph nodes and lung nodules. MR imaging should not be used to establish the initial diagnosis of lung cancer. Significant overlap exists between the T1, T2, and contrast enhancement characteristics of benign and malignant lung masses on MR imaging. However, MR imaging may provide certain benefits over CT in specific circumstances. The advantages of MR imaging are based on multiplanar imaging capabilities, superb depiction of vascular anatomy and blood flow, and high soft tissue contrast. Although destruction of rib cortex is more easily identified by CT, MR can identify tumor infiltration of rib bone marrow. MR imaging is probably best used as a problem-solving tool for inconclusive CT scan results. MR imaging has been particularly valuable in determining the resectability of superior sulcus (Pancoast's) tumors and assessing tumor invasion of mediastinal structures, chest wall, and spine. In patients who cannot receive iodinated contrast media for CT, MR imaging should be used as the primary imaging modality for staging lung cancer.
A study by the Radiologic Diagnostic Oncology Group showed no significant difference in the accuracy of CT and MR in staging lung cancers. The primary role of imaging is to distinguish between T3N0M0 disease (stage IIB) and T4 disease (stage IIIB). T3N0 1M0 disease, which is potentially resectable, is characterized by direct tumor extension into the chest wall, diaphragm, mediastinal pleura, or pericardium, or to within 2 cm of the carina. Stage IIIB disease, which is unresectable, is characterized by tumor invasion of the mediastinum, heart, great vessels, trachea, esophagus, carina, or vertebral bodies. Stage IIIB disease also includes cases with malignant adenopathy in the contralateral mediastinal or hilar nodal groups and those with malignant pleural effusions.
P.189
MR and CT have similar accuracy in evaluating hilar masses and adenopathy. Occasionally, on CT, it is difficult to distinguish a hilar mass from an adjacent pulmonary vessel. In these instances, MR imaging may be of value. Flowing blood usually produces a signal void (i.e., flow void) in the pulmonary vessels on spin echo MR images, allowing the vessels to be differentiated from hilar nodes and masses. Unfortunately, slow flow can lead to significant intravascular signal and negate the advantage of MR imaging. Tumors in the hilum can cause postobstructive atelectasis and pneumonitis. CT is superior to MR imaging for identifying obstructive endobronchial lesions. However, MR imaging can often differentiate atelectatic or pneumonitic lung from obstructing tumor. T2-weighted MR images can identify fluid-filled air spaces in the postobstructive lung (drowned lung).
Although acquisition of CT images of the thorax is limited to the axial plane, MR images can be acquired in any orthogonal or oblique plane. This feature may provide an advantage for MR imaging in assessing tumor invasion. For tumor adjacent to the heart, MR imaging is valuable in distinguishing invasion of the pericardium from invasion of the cardiac muscle. The distinction is often best made on T1-weighted images, where the pericardium is seen as a discrete low-signal structure that is separated from cardiac muscle by high-signal pericardial fat. MR imaging also can depict tumor extending to or encasing the carina, aorta, and pulmonary arteries. If vascular encasement is present, Gd-enhanced 3D MR angiography can assess the degree of luminal narrowing (Fig. 11-16). A combination of spin echo and MR angiography often suffices to identify narrowing of the SVC and distinguish extrinsic compression from direct tumor invasion.
Adrenal Metastases
MR can help to characterize adrenal masses in patients with lung cancer. CT is currently the primary modality for evaluating the abdomen for metastases. Adrenal masses are discovered incidentally on 21% of CT examinations for staging lung cancer, and more than two thirds of these are benign adrenal adenomas. However, CT is unable to characterize the adrenal mass as benign or malignant in approximately 40% of cases. Chemical shift MR imaging is a powerful technique that detects microscopic fat within an adrenal mass with greater specificity than CT. About 90% of adrenal adenomas contain significant amounts of microscopic fat, whereas adrenal metastases from lung contain none. Chemical shift imaging consists of a pair of gradient echo MR images that are identical in all respects except for different TE values. The specific TE values depend on the magnetic field strength of the MR scanner. At 1.5 tesla, these values are 2.1 and 4.2 ms. The TE of 2.1 ms is said to be out of phase or opposed phase, and the TE of 4.2 ms is in phase because of the relative direction of the magnetization vectors for fat and water protons. When the signal intensity of an adrenal mass on the in-phase image is arbitrarily set to 100%, most adrenal adenomas lose signal on the out-of-phase image; adrenal metastases show no signal loss. About 10% of adrenal adenomas cannot be characterized as benign using chemical shift imaging. However, chemical shift imaging has proved to be more reliable for evaluating adrenal masses than other MR-based methods, such as calculating T1 and T2 values or following dynamic contrast enhancement.
 |
Fig. 11-16. Small cell lung cancer invading the mediastinum. Axial, electrocardiogram-gated, T1-weighted spin echo MR image (A) shows a soft tissue mass (M) of intermediate signal intensity that obliterates the left pulmonary artery and left main-stem bronchus and narrows the right pulmonary artery (arrowhead). An axial maximum-intensity projection image from gadolinium-enhanced 3D MR angiography (B) shows to greater advantage the severe segmental narrowing of the proximal left pulmonary artery (curved arrow) and milder, focal narrowing of the proximal right pulmonary artery (arrowhead). A prior radionuclide ventilation-perfusion lung scan revealed severely decreased left lung perfusion (not shown). |
Superior Sulcus Tumors
Superior sulcus (Pancoast's) tumors arise from the apex of the lung close to the visceral pleural surface. These
P.190
lesions show a propensity for invading the chest wall and may involve the brachial plexus, subclavian vessels, and spine (see Chapters 35 and 36). Treatment depends on which structures are involved. Gross involvement of the brachial plexus, encasement of the subclavian artery, and involvement of a large portion of a vertebral body or extension into the spinal canal generally render these cancers unresectable. CT is usually the first cross-sectional imaging study obtained for staging superior sulcus tumors. However, the axial plane can be suboptimal for assessing local tumor invasion. The multiplanar capabilities of MR imaging make it uniquely suited to evaluating these lesions. Three imaging planes, axial, coronal, and sagittal, are often required to assess all anatomic relationships. All of the important structures that can be invaded by these tumors are well visualized by MR, allowing for a more accurate determination of the resectability. MR pulse sequences on which fat appears bright, such as T1-weighted spin echo, are useful for assessing chest wall invasion. Invasion is suspected on T1-weighted pulse sequences when tumor, which exhibits low signal intensity, violates the subpleural fat plane. A similar approach can be used to assess tumor invasion of the brachial plexus and subclavian vessels because these structures are also surrounded by fat. Gd-enhanced 3D MR angiography also can be used to evaluate arteries and veins for tumor invasion. Multidetector CT is challenging the preeminence of MR for multiplanar thoracic imaging. High spatial resolution axial images from a 16-slice CT scanner can now be reconstructed on a computer workstation to produce high-quality sagittal, coronal, and oblique images.
Posttreatment Evaluation
The early detection of recurrent tumor after surgery or radiation therapy may be difficult by chest radiography or CT. Granulation tissue and fibrosis in the postsurgical or postradiation bed can simulate or obscure tumor foci. This distinction can be difficult on MR imaging as well. One exception is mature fibrosis, which characteristically exhibits low signal intensity on T1- and T2-weighted images. Unfortunately, significant overlap occurs in the MR appearances of active fibrosis, inflammation, and recurrent tumor. Efforts to differentiate these entities based on T1 and T2 signal characteristics or the kinetics of contrast enhancement have proved unreliable. Fluorodeoxyglucose (FDG) PET scanning appears more promising in this regard (see Chapter 12).
LUNG PARENCHYMA
MR imaging will probably never image lung parenchyma as well as CT. Conventional and high-resolution CT provide exquisite anatomic detail of lung parenchyma and air spaces. This detail is often critical for correctly diagnosing lung pathology on CT. In stark contrast, normal lung parenchyma usually appears as a signal void on conventional MR images. Standard spin echo pulse sequences also do not depict the pulmonary vasculature, except for the central vessels. The poor signal intensity of lung is caused by low intrinsic proton density and strong magnetic susceptibility gradients that cause intravoxel dephasing and signal loss. Work with ultrashort TE (0.7 ms) gradient echo pulse sequences and high-speed gradients, both of which minimize magnetic susceptibility effects, has produced modest success in imaging lung interstitium and small lung nodules. However, neither the specialized pulse sequence nor the scanner hardware is widely available. Thus, MR imaging currently should not be used to evaluate lung parenchyma.
MR imaging may play a limited role in evaluating space-occupying lesions of lung because these are less affected by magnetic susceptibility artifact. In one study, MR imaging detected all lung nodules greater than 5 mm in diameter but failed to detect several smaller (2 to 4 mm) nodules that were identified by CT. Sometimes, the inability of conventional MR imaging to detect intrapulmonary blood vessels offers an advantage over CT by increasing the conspicuity of small pulmonary nodules that are adjacent to blood vessels. MR imaging falls short of CT in characterizing pulmonary nodules. Nodule characterization is often based on the presence and distribution of calcium, which MR imaging cannot detect. MR imaging cannot reliably distinguish benign from malignant pulmonary nodules. Efforts to characterize nodules based on their T1 and T2 appearance or dynamic contrast enhancement have proved unrewarding.
CHEST WALL
Most primary neoplasms of the chest wall, except for skin, are of mesenchymal origin. The most common soft tissue tumor of the chest wall is a lipoma. Lipomas are benign lesions; however, they can appear aggressive when they extend between muscles or into a subpleural location. Lipomas have a characteristic appearance on MR imaging: they are homogeneously bright on T1-weighted images and become dark on fat-suppressed images. Although other benign lesions of the chest wall occur, most cannot be proved to be benign by MR imaging. Malignancies of the chest wall may be caused by primary neoplasms, contiguous spread from mediastinal or lung neoplasms, or metastatic disease. Malignant lesions often have areas of necrosis, hemorrhage, or both. They usually exhibit a heterogeneous appearance on both T1- and T2-weighted images and enhance after intravenous contrast administration. It is usually impossible to offer a specific tissue diagnosis for a malignant chest wall mass
P.191
based on its MR appearance. Furthermore, considerable overlap exists in the MR appearance of benign and malignant lesions. The strength of MR imaging lies in its ability to define the anatomic relationships between a chest wall mass and surrounding structures.
PLEURAL DISEASES
Pleural pathology is adequately delineated by either chest radiography or CT, although MR imaging can be useful in selected situations. Early work suggests that MR imaging may be able to classify noninvasively pleural fluid collections as transudative, exudative, or complex. The high signal intensity of lipids and subacute blood products on T1-weighted sequences allows the identification of chylothorax and hemothorax, respectively. The multiplanar capability of MR can be useful for determining whether a pathologic process is located in the lung parenchyma, pleura, or extrapleural space (Fig. 11-17). The high soft tissue contrast of MR imaging, especially after Gd enhancement, can be helpful in distinguishing complex fluid collections from solid neoplasms.
Malignant mesothelioma is an aggressive neoplasm of the pleura with a poor prognosis. The staging of mesothelioma helps determine the appropriate therapy, including surgery. Although CT is the primary imaging modality for staging this disease, MR imaging may play an adjunctive role when CT findings are equivocal. Multiplanar MR imaging may be useful for demonstrating invasion of the mediastinum, pericardium, chest wall, and diaphragm (Fig. 11-18).
DIAPHRAGM
The complex shape of the diaphragm makes it difficult to assess on axial images. Moreover, on axial images, it may be difficult to determine the location and extent of juxtadiaphragmatic pathology. MR imaging in the sagittal and coronal planes can determine whether a mass is above or below the diaphragm or invades the diaphragm. Breath-hold imaging techniques, such as fast gradient echo and single-shot fast spin echo, eliminate respiratory motion artifact while providing adequate soft tissue contrast. Currently, clinical experience with MR imaging of the diaphragm is limited but increasing. Multiplanar MR imaging may be useful in the preoperative planning for repair of traumatic diaphragmatic rupture and congenital diaphragmatic hernias. More recently, MR imaging has been used to study diaphragmatic motion in lieu of fluoroscopy. This may be of value in assessing phrenic nerve paralysis as well as determining suitability for lung reduction surgery.
 |
Fig. 11-17. Benign fibrous tumor of pleura. Axial (A) and sagittal (B) gadolinium-enhanced T1-weighted MR images demonstrate a large, nonaggressive, pleural-based mass that occupies almost the entire middle and lower right pleural cavity. Note the smooth interface between the mass and lung parenchyma (B, arrowheads) and how the mass extends into the major fissure (B, arrow). The mass abuts the pericardium (A, open arrow) and azygoesophageal recess (A, closed arrow), but does not invade either structure. The sagittal image (B) clearly shows that the mass is separate from the liver. Dilated pulmonary vessels in the right pericardiophrenic angle (A, open curved arrow) are probably the result of impaired pulmonary venous return. |
P.192
FUNCTIONAL MAGNETIC RESONANCE IMAGING OF THE LUNGS
Exciting new MR techniques are emerging that have the potential to provide information on regional lung function, including ventilation, perfusion, [V with dot above]/[Q with dot above] ratio, intrapulmonary oxygen partial pressure (Po2), gas exchange, and spirometric and biomechanical parameters. The ability of these new imaging techniques to map these functional parameters spatially throughout each lung, even down to individual lobes or even smaller regions, represents a significant advantage over traditional pulmonary function tests. The latter are limited to global measures of total lung function.
 |
Fig. 11-18. Thoracic mesothelioma. Coronal MR images demonstrate a bulky, lobulated, pleural-based soft tissue mass in the right hemithorax that demonstrates intermediate T1 signal (A) and high T2 signal (B). Mesothelioma extends into the major fissure (A, arrow). The mesothelioma shows predominantly peripheral enhancement on a fat-suppressed, gadolinium-enhanced, T1-weighted image (C). The tumor invades the upper surface of the right hemidiaphragm but does not invade the liver. Note that the fat plane between the diaphragm and liver is preserved (C, arrowheads). |
Although a number of the functional imaging techniques described here are currently investigational, they have significant potential clinical as well as research applications. The techniques have the potential to detect early disease before the onset of gross morphologic abnormalities. Being quantitative, these methods could be used to help monitor disease activity as well as evaluate the response to various therapeutic interventions. Perhaps of greatest interest is the potential of these methods to identify regions of the lungs demonstrating maximum pathophysiology. This information may prove useful in planning for lung resections in patients with underlying advanced lung disease, including its use in lung volume reduction surgery for emphysema.
P.193
MAGNETIC RESONANCE VENTILATION IMAGING
Laser-polarized 3He MR images can yield very high-signal functional displays of the 3He ventilated air spaces with high spatial and temporal resolution and without ionizing radiation (see Fig. 11-1). The latter enables multiple scans to be repeated serially over time. The technique is limited, however, by the relatively high cost and restricted availability of the 3He gas, which is currently an investigational agent. High-resolution volumetric images of ventilation have demonstrated localized defects in gas distribution in a variety of pulmonary disorders, including asthma, emphysema, and bronchiolitis obliterans.
In addition to static and dynamic ventilation imaging, 3He scans can be used to derive several important new parameters of pulmonary function. These parameters include information on pulmonary microstructure (alveolar size and wall thickness), regional oxygen partial pressure, regional oxygen uptake, and [V with dot above]/[Q with dot above] matching.
Diffusion-weighted MR imaging sequences can yield quantitative maps of the apparent diffusion coefficient (ADC) of the 3He gas. Normal alveoli demonstrate homogeneously restricted gas diffusion on these diffusion-weighted 3He scans. In contrast, high (i.e. less restricted) ADCs reflect abnormally enlarged air spaces and provide a sensitive means to detect emphysema as well as honeycombing in pulmonary fibrosis.
Oxygen-sensitive imaging represents another potential application of 3He MR. Molecular oxygen, being paramagnetic, shortens the T1 of hyperpolarized 3He, thereby destroying its signal. Regions of lung with high Po2 will therefore lose 3He signal more rapidly than those with lower oxygen concentrations. Thus, 3He MR can be used to map oxygen partial pressures quantitatively in the lungs as well as to assess regional oxygen uptake and [V with dot above]/[Q with dot above]. Alveolar-capillary transfer of oxygen can be evaluated by measuring the decrease in regional Po2 during a breath-hold. With pulmonary arterial obstruction, interrupted uptake of oxygen from the alveoli into the blood can be detected as an area of abnormally high [V with dot above]/[Q with dot above] using the oxygen-sensitive 3He MR technique.
Molecular oxygen, which is weakly paramagnetic, can also be used as an MR agent to assess ventilation in proton MR imaging. The diffusion of oxygen from the alveoli into the capillary blood results in a reduction in the T1 of the blood and thus an increase in lung signal on a T1-weighted sequence. By subtracting an image acquired with room air from one acquired with 100% oxygen, oxygen-enhanced MR lung scans are obtained. Unlike hyperpolarized 3He, in which the signal is obtained directly from the gas itself, the signal obtained using molecular oxygen as a ventilation agent results from its paramagnetic effect on the alveolar capillary blood and other interstitial water.
Hyperpolarized 129Xe represents another exciting approach to MR imaging of lung function. Unlike hyperpolarized 3He, 129Xe readily diffuses into interstitial tissues and alveolar blood. MR spectroscopic techniques can be used to measure separately the 129Xe signal in alveolar gas, interstitial parenchyma, and alveolar capillary blood. By following the diffusion of the gas from the alveoli into the blood, the hyperpolarized 129Xe scans have the potential to map regional ventilation, perfusion, and [V with dot above]/[Q with dot above], all within a single examination. Moreover, the kinetics of gas transfer from air space to capillary could potentially be used to calculate a host of other parameters, including alveolar wall thickness, capillary blood volume, mean alveolar transit time, and pulmonary perfusion.
Finally, pulmonary ventilation scans have also been obtained using Gd-containing aerosols and proton MR imaging.
MAGNETIC RESONANCE PULMONARY PERFUSION IMAGING
Pulmonary perfusion can be assessed with the use of ultra-short TE T1-weighted sequences together with Gd contrast agents. Applications of MR perfusion scans include the evaluation of pulmonary embolism, lung transplantation, and lung volume reduction surgery and the characterization of solitary pulmonary nodules.
Furthermore, by fitting the time-intensity curve obtained from a dynamic contrast-enhanced study to a -variate function, flow parameters such as peak time, apparent mean transit time, and blood volume can be calculated. Fast contrast-enhanced 3D MR techniques using short TR and TE allow depiction of the pulmonary vasculature through a pulmonary MR angiogram as well as assessment of parenchymal perfusion within a single breath-hold. In feasibility studies performed in porcine models and in patients with pulmonary embolism, the combined MR angiography and perfusion scan demonstrated abnormalities of the pulmonary arteries as well as the accompanying perfusion defects. The ability to couple pulmonary MR angiography with the corresponding perfusion image not only promises to increase the accuracy of MR for detecting clots but also may enable the functional consequences of pulmonary emboli on lung perfusion to be quantified. Similar techniques are now being developed using multislice helical CT scanners.
Another approach to evaluating pulmonary perfusion with MR is that of arterial spin labeling (also known as arterial spin tagging). This method requires no exogenous contrast agent. Instead, localized adiabatic rf pulses are used to invert the magnetization of blood in the pulmonary arteries. By subtracting images acquired with and without the arterial labeling pulses, perfusion images of the lungs can be obtained. Although the resulting spatial resolution is less than for the Gd-enhanced technique, the arterial spin-labeling technique can provide nearly real-time volumetric imaging of pulmonary perfusion. Moreover, because no contrast agent is injected and no ionizing radiation is
P.194
involved, the scans can be repeated as often as desired. Arterial spin tagging provides a very powerful tool for investigating the effects of various interventions or agents on regional pulmonary perfusion.
MAGNETIC RESONANCE VENTILATION-PERFUSION MAPPING
Several new approaches for directly obtaining 3D displays of [V with dot above]/[Q with dot above] ratio with high spatial resolution are being investigated. The potential of 129Xe and 3He for [V with dot above]/[Q with dot above] MR imaging has been indicated previously. Moreover, it is also possible to combine quantitative images of ventilation and perfusion. For example, coregistration of Gd- or arterial spin-labeling based perfusion scans with either 3He or oxygen MR ventilation scans has been reported.
MAGNETIC RESONANCE IMAGING OF LUNG MECHANICS
Another recent area of development in functional MR imaging of the lungs is that of pulmonary mechanics. The high temporal and spatial resolution of the volumetric MR image data sets can be used to obtain regional rather than global spirometric parameters and other measures of lung mechanics. Potential uses include the mapping of abnormal regional compliance in patients with emphysema, particularly those being considered for lung volume reduction surgery, as well as in patients with pulmonary fibrosis.
Several MR-based methods to study lung mechanics have been reported. These methods capitalize on recent advances in fast MR imaging techniques that provide better depiction of pulmonary parenchymal structures. Two MR approaches have been used to quantify tissue deformation and localized lung inflation: tissue tagging to track lung motion, and displacement vector maps derived from the registration of serial images acquired during respiration using the pulmonary vasculature and parenchymal structures as inherent spatial markers. Mapping of regional lung mechanics using these new techniques can add unique, previously unavailable functional information beyond the ventilation and perfusion imaging just described.
FUTURE OF MAGNETIC RESONANCE IMAGING
Radiologists and surgeons will be challenged to stay abreast of new developments in MR imaging. MR angiography may eventually replace conventional angiography for evaluation of the thoracic aorta. Ultrafast pulse sequences and hyperpolarized noble gases will provide better images of lung parenchyma and air spaces, respectively. The pulmonary [V with dot above]/[Q with dot above] scans of the future could well be an MR image. New MR contrast agents will improve lesion detection and characterization. New MR imaging techniques are beginning to provide regional functional as well as anatomic information. These MR methods may, for the first time, provide spatial maps of intrapulmonary Po2, gas exchange, [V with dot above]/[Q with dot above], and pulmonary compliance.
MR methods of imaging the chest will have to be weighed against concurrent advances in CT technology. State-of-the-art multislice helical CT scanners can now obtain sub-millimeter-thick sections through the entire thorax in less than 10 seconds, providing for high-resolution CT angiography of the chest as well as thin-section parenchymal images of the entire lungs within a breath-hold.
It is a mistake, however, to become mesmerized by technology. Although MR imaging can produce dazzling images of many thoracic disease processes, our mandate as health care providers is to choose the safest, most accurate, and most cost-effective imaging modality for our patients.
Reading References
Albert MS, et al: Biological magnetic resonance imaging using laser-polarixed 129Xe. Nature 370:199, 1994.
Alley MT, et al: Ultrafast contrast-enhanced three-dimensional MR angiography: state of the art. Radiographics 18:273, 1998.
Alsop DC, et al: Multi-slice imaging of lung parenchyma in a single breath-hold using a sub-millisecond echo time fast gradient-echo sequence. Magn Reson Med 33:678, 1995.
Altes T, et al: Hyperpolarized 3He MR lung ventilation imaging in asthmatics: preliminary findings. J Magn Reson Imag 13:378, 2001.
Amundsen T, et al: Pulmonary embolism: detection with MR perfusion imaging of lung. A feasibility study. Radiology 203:181, 1997.
Aronberg DJ, et al: The superior sinus of the pericardium: CT appearance. Radiology 153:489, 1984.
Axel L, Dougerty L: MR imaging of motion with spatial modulation of magnetization. Radiology 171:841, 1989(a).
Axel L, Dougherty L: Heart wall motion: improved method of spacial modulation of magnetization for MR imaging. Radiology 172:349, 1989(b).
Auffermann W, et al: Diagnosis of recurrent hyperparathyroidism: comparison of MR imaging and other imaging techniques. AJR Am J Roentgenol 150:1027, 1988.
Bachert P, et al: Nuclear magnetic resonance imaging of airways in humans with use of hyperpolarized 3He. Magn Reson Med 36:192, 1996.
Bailes DR, et al: Respiratory ordered phase encoding (ROPE): a method for reducing respiratory motion artifacts in MR imaging. J Comput Assist Tomogr 9:835, 1985.
Bank ER: Magnetic resonance of congenital cardiovascular disease. Radiol Clin North Am 31:553, 1993.
Bergin CJ, Glover GH, Pauly JM: Lung parenchyma: magnetic susceptibility in MR imaging. Radiology 180:845, 1991.
Bergin CJ, et al: MR evaluation of chest wall involvement in malignant lymphoma. J Comput Assist Tomogr 14:928, 1990.
Bergin CJ, et al: MR imaging of lung parenchyma: a solution to susceptibility. Radiology 183:673, 1992.
Berlin SC: Magnetic resonance imaging of the cardiovascular system and airway. Pediatr Clin North Am 44:659, 1997.
Berthezene Y, et al: Magnetic resonance imaging detection of an experimental pulmonary perfusion deficit using a macromolecular contrast agent. Polylysine-gadolinium-DTPA40. Invest Radiol 27:346, 1992.
Berthezene Y, et al: Safety aspects and pharmacokinetics of inhaled aerosolized gadolinium. J Magn Reson Imaging 3:125, 1993.
Berthezene Y, et al: Lung perfusion demonstrated by contrast-enhanced dynamic magnetic resonance imaging. Application to unilateral lung transplantation. Invest Radiol 32:351, 1997.
Bittner RC, Felix R: Magnetic resonance imaging of the chest: state-of-the-art. Eur Respir J 11:1392, 1998.
P.195
Bock JC, et al: Gd-DTPA-polylysine-enhanced pulmonary time-of-flight MR angiography. J Magn Reson Imaging 4:473, 1994.
Boiselle PM, et al: Imaging of mediastinal lymph nodes: CT, MR, and FDG PET. Radiographics 18:1061, 1998.
Bonomo L, et al: Lung cancer staging: the role of computed tomography and magnetic resonance imaging. Eur J Radiol 23:35, 1996.
Bourgouin PM, et al: Differentiation of bronchogenic carcinoma from postobstructive pneumonitis by magnetic resonance imaging: histopathologic correlation. J Thorac Imaging 6:22, 1991.
Cantoni S, et al: Enhancement of pleural effusions on MR images obtained after intravenous administration of Gd-DTPA. Radiology 193(P):148, 1994.
Castellino RA: Hodgkin disease: practical concepts for the diagnostic radiologist. Radiology 159:305, 1986.
Castellino RA: The non-Hodgkin lymphomas: practical concepts for the diagnostic radiologist. Radiology 178:315, 1991.
Chang YC, et al: Magnetic resonance angiography in the diagnosis of thoracic venous obstruction. J Formos Med Assoc 97:38, 1998.
Chen Q, et al: Pulmonary disorders: ventilation-perfusion MR imaging with animal models. Radiology 213:871, 1999.
Chong VF: Imaging thoracic malignancy. Ann Acad Med Singapore 24:254, 1995.
Cigarroa JE, et al: Diagnostic imaging in the evaluation of suspected aortic dissection: old standards and new directions. N Engl J Med 328:35, 1993.
Coady MA, et al: Penetrating ulcer of the thoracic aorta: what is it? how do we recognize it? how do we manage it? J Vasc Surg 27:1015, 1998.
Cooke JP, Kazmier FJ, Orszulak TA: The penetrating aortic ulcer: pathologic manifestations, diagnosis, and management. Mayo Clin Proc 63:718, 1988.
Cotran RS, Kumar V, Robbins SL: Robbins Pathologic Basis of Disease. 5th Ed. Philadelphia: WB Saunders, 1994.
Davis CP, et al: Postprocessing techniques for gadolinium-enhanced three-dimension MR angiography. Radiographics 17:1061, 1997.
Davis SD, et al: MR imaging of pleural effusions. J Comput Assist Tomogr 14:192, 1990.
De Bakey ME, Cooley DA, Creech O Jr: Surgical considerations of dissecting aneurysm of the aorta. Ann Surg 142:586, 1955.
De Bakey M, et al: Surgical management of dissecting aneurysms of the aorta. J Thorac Cardiovasc Surg 49:130, 1965.
de Lange EE, et al: Lung air spaces: MR imaging evaluation with hyperpolarized 3He gas. Radiology 210:851, 1999.
Deninger AJ, et al: Quantification of regional intrapulmonary oxygen partial pressure evaluation during apnea by 3Helium MRI. J Magn Reson 141:207, 1999.
Deninger AJ, et al: 3He-MRI-based measurements of intrapulmonary Po2 and its time course during apnea in healthy volunteers: first results, reproducibility, and technical limitations. NMR Biomed 13:194, 2000.
Deutsch HJ, et al: Chronic aortic dissection: comparison of MR imaging and transesophageal echocardiography. Radiology 192:645, 1994.
Doyle AJ: Demonstration of blood supply to pulmonary sequestration by MR angiography. AJR Am J Roentgenol 158:989, 1992.
Eberle B, et al: Analysis of intrapulmonary O2 concentration by MR imaging of inhaled hyperpolarized helium-3. J Appl Physiol 87:2043, 1999.
Erdman WA, et al: Pulmonary embolism: comparison of MR images with radionuclide and angiographic studies. Radiology 190:499, 1994.
Evans AJ, et al: Detection of deep venous thrombosis: prospective comparison of MR imaging with contrast venography. AJR Am J Roentgenol 161:131, 1993.
Falaschi F, et al: MR signal as a predictive index of malignant pleural disease. Radiology 193(P):147, 1994.
Felson B: Chest Roentgenology. Philadelphia: WB Saunders, 1973.
Ferguson ER, et al: Evaluation of complex mediastinal masses by magnetic resonance imaging. J Cardiovasc Surg 39:117, 1998.
Feuerstein IM, et al: Pulmonary metastases: MR imaging with surgical correlation: a prospective study. Radiology 182:123, 1992.
Finn JP, et al: Central venous occlusion: MR angiography. Radiology 187:245, 1993.
Fisher MR, Higgins CB, Andereck W: MR imaging of an intrapericardial pheochromocytoma. J Comput Assist Tomogr 9:1103, 1985(a).
Fisher MR, Higgins H, Higgins CB: Magnetic resonance imaging of developmental venous anomalies. AJR Am J Roentgenol 145:705, 1985(b).
Flamm SD, VanDyke CW, White RD: MR imaging of the thoracic aorta. Magn Reson Imaging Clin N Am 4:217, 1996.
Foo TK, et al: Pulmonary vasculature: single breath-hold MR imaging with phased-array coils. Radiology 183:473, 1992.
Fortier M, et al: MR imaging of chest wall lesions. Radiographics 14:597, 1994.
Fraser RG, et al: Synopsis of Diseases of the Chest. 2nd Ed. Philadelphia: WB Saunders, 1994.
Fujimoto K, et al: Gd-DTPA-enhanced dynamic MR imaging in pulmonary disease: evaluation of usefulness in differentiating benign from malignant disease. Radiology 189(P):438, 1993.
Galli R, et al: Surgical indications and timing of repair of traumatic ruptures of the thoracic aorta. Ann Thorac Surg 65:461, 1998.
Gast KK, et al: MRI using hyperpolarized 3He-gas. Acad Radiol 10:1119, 2003.
Gaubert JY, et al: Type A dissection of the thoracic aorta: use of MR imaging for long-term follow-up. Radiology 196:363, 1995.
Gee J, et al: Characterization of regional pulmonary mechanics from serial MRI data. Acad Radiol 10:1147, 2003.
Gefter WB: Magnetic resonance imaging in the evaluation of lung cancer. Semin Roentgenol 25:73, 1990.
Gefter WB: Functional CT imaging of the lungs: the pulmonary function test of the new millennium? [Guest editorial]. Acad Radiol 9:127, 2002.
Gefter WB, Hatabu H: Evaluation of pulmonary vascular anatomy and blood flow by magnetic resonance. J Thorac Imag 8:122, 1993.
Gefter WB, Hatabu H: Functional lung imaging: emerging methods to visualize regional pulmonary physiology. [Guest editorial]. Acad Radiol 10:1058, 2003.
Gefter WB, Kundel H, Hatabu H: Magnetic resonance imaging in chest medicine. In Fishman AP (ed): Update: Pulmonary Diseases and Disorders. New York: McGraw-Hill, 1992.
Gefter WB, et al: Pulmonary vascular cine MR imaging: a noninvasive approach to dynamic imaging of the pulmonary circulation. Radiology 176:761, 1990.
Gefter WB, et al: Pulmonary thromboembolism: recent developments in diagnosis using computed tomography and magnetic resonance imaging. State-of-the-Art Radiology 197:561, 1995(a).
Gefter WB, et al: New directions in MR research in the lung. In Cutillo AG (ed): Application of Magnetic Resonance to the Study of Lung. Armonk, NY: Futura, 1995(b).
Gierada DS, et al: Diaphragmatic motion: fast gradient-recalled-echo MR imaging in healthy subjects. Radiology 194:879, 1995.
Gomori JM, Grossman RI: Mechanisms responsible for the MR appearance and evolution of intracranial hemorrhage. Radiographics 8:427, 1988.
Grist TM, et al: Pulmonary angiography with MR imaging: preliminary clinical experience. Radiology 189:523, 1993.
Groch MW, Turner DA, Erwin WD: Respiratory gating in magnetic resonance imaging: improved image quality over non-gated images for equal scan time. Clin Imaging 15:196, 1991.
Grover FL: The role of CT and MR imaging in staging of the mediastinum. Chest 106:3915, 1994.
Guckel C, et al: Solitary pulmonary nodules: MR evaluation of enhancement patterns with contrast-enhanced dynamic snapshot gradient-echo imaging. Radiology 200:681, 1996.
Gupta A, et al: Acute pulmonary embolism: diagnosis with MR angiography. Radiology 210:353, 1999.
Haacke EM, Lenz GW: Improving image quality in the presence of motion by using rephasing gradients. AJR Am J Roentgenol 148:1251, 1987.
Haggar AM, Froelich JW: MR imaging strategies in primary and metastatic malignancies. Radiol Clin North Am 26:689, 1988.
Hartnell GG: Magnetic resonance angiography of the thoracic aorta. Magn Reson Imaging Clin N Am 1:315, 1993.
Hartnell GG, et al: MR imaging of the thoracic aorta: comparison of spin-echo, angiographic, and breath-hold techniques. Radiology 191:697, 1994.
Hartnell GG, et al: Magnetic resonance angiography of the central chest veins. Chest 107:1053, 1995.
Hasegawa I, et al: Voxelwise mapping of MR ventilation-perfusion ratio in a porcine model by multi-modality registration: technical note. Acad Radiol 10:1091, 2003.
Hata A, Numano F: Magnetic resonance imaging of the vascular changes in Takayasu arteritis. Int J Cardiol 52:45, 1995.
P.196
Hatabu H, Gefter WB: Clinical Applications of Magnetic Resonance in the Pulmonary Vasculature. In Cutillo AG (ed): Application of Magnetic Resonance to the Study of Lung. Armonk, NY: Futura, 1995.
Hatabu H, Wielopolski P, Tadamura E: An attempt of pulmonary perfusion imaging utilizing ultrashort TE turbo FLASH sequence with signal targeting and alternating radio-frequency. Eur J Radiol 29:160, 1999.
Hatabu H, et al: Magnetic resonance approaches to the evaluation of pulmonary vascular anatomy and physiology. Magn Reson Q 7:208, 1991.
Hatabu H, et al: MR imaging with spatial modulation of magnetization in the evaluation of chronic central pulmonary thromboembolism. Radiology 190:791, 1994(a).
Hatabu H, et al: MR imaging and T2* measurement of lung parenchyma using a new submillisecond TE gradient echo sequence. Radiology 193:147, 1994(b).
Hatabu H, et al: Pulmonary perfusion: qualitative assessment with dynamic contrast-enhanced MR imaging using ultra-short TE and inversion recovery turboflash. Magn Reson Med 36:503, 1996(a).
Hatabu H, et al: Pulmonary perfusion and angiography: evaluation with breath-hold enhanced three-dimensional fast imaging steady state precession MR imaging with short TR and TE. AJR Am J Roentgenol 167:653, 1996(b).
Hatabu H, et al: Pulmonary perfusion: qualitative assessment with dynamic contrast-enhanced MRI using ultra-short TE and inversion recovery turbo FLASH. Magn Reson Med 36:503, 1996(c).
Hatabu H, et al: Quantitative assessment of pulmonary perfusion with dynamic contrast-enhanced MRI. Magn Reson Med 42:1033, 1999.
Hatabu H, et al: Noninvasive pulmonary perfusion imaging by STAR_ HASTE sequence. Magn Reson Med 44:808, 2000.
Heelan RT, et al: Magnetic resonance imaging of the postpneumonectomy chest: normal and abnormal findings. J Thorac Imag 12:200, 1997.
Heelan RT, et al: Superior sulcus tumors: CT and MR imaging. Radiology 170:637, 1989.
Henning J, Naverth A, Friedburg H: RARE imaging: fast imaging method for clinical MR. Magn Reson Med 3:823, 1986.
Higgins CB: Role of magnetic resonance imaging in hyperparathyroidism. Radiol Clin North Am 31:1017, 1993.
Higgins CB, Auffermann W: MR imaging of thyroid and parathyroid glands: A review of current status. AJR Am J Roentgenol 151:1095, 1988.
Hill SL, Berry RE: Subclavian vein thrombosis: a continuing challenge. Surgery 108:1, 1990.
Ho VB, Prince MR: Thoracic MR aortography: imaging techniques and strategies. Radiographics 18:287, 1998.
Holland GA, et al: Prospective comparison of pulmonary MR angiography and ultrafast CT for diagnosis of pulmonary thromboembolic disease. Radiology 189(P):234, 1993.
Holmvang G: Usefulness of MR imaging in aortic dissection. N Engl J Med 326:1670, 1992.
Horattas MC, Wright DJ, Fenton AH: Changing concepts of deep venous thrombosis of the upper extremity: report of a series and review of the literature. Surgery 104:561, 1988.
Hsu BY, Edwards DK, Trambert MA: Pulmonary hemorrhage complicating systemic lupus erythematosus: role of MR imaging in diagnosis. AJR Am J Roentgenol 158:519, 1992.
Hughes JP, Ruttley MS, Musumeci F: Case report: traumatic aortic rupture: demonstration by magnetic resonance imaging. Br J Radiol 67: 1264, 1994.
Im J-G, et al: MR imaging of the transverse sinus of the pericardium. AJR Am J Roentgenol 150:79, 1988.
Ionescu AA, et al: Periaortic fat pad mimicking an intramural hematoma of the thoracic aorta: lessons for transesophageal echocardiography. J Am Soc Echocardiogr 11:487, 1998.
Jelinek JS, et al: Small cell lung cancer: staging with MR imaging. Radiology 177:837, 1990.
Johansen K: Infected and other unusual aneurysms. In Bergan JJ, Yao JST (eds): Aortic Surgery. Philadelphia: WB Saunders, 1989.
Joyce JW, et al: Aneurysms of the thoracic aorta: a clinical study with special reference to prognosis. Circulation 29:176, 1964.
Kang YS, et al: Localization of abnormal parathyroid glands of the mediastinum with MR imaging. Radiology 189:137, 1993.
Katz ES, et al: Tortuosity of the descending thoracic aorta simulating dissection on transesophageal echocardiography. J Am Soc Echocardiogr 10:83, 1997.
Kauczor H, Surkau R, Roberts T: MR imaging using hyperpolarized gases. Eur J Radiol 8:820, 1998.
Kauczor HU, et al: Normal and abnormal pulmonary ventilation: visualization at hyperpolarized He-3 MR imaging. Radiology 201:564, 1996.
Kauczor HU, et al: Imaging of the lungs using 3He MRI: preliminary clinical experience in 18 patients with and without lung disease. J Magn Reson Imaging 7:538, 1997.
Kawamoto S, et al: Thoracoabdominal aorta in Marfan syndrome: MR imaging findings of progression of vasculopathy after surgical repair. Radiology 203:727, 1997.
Kawashima A, Fishman EK, Kuhlman JE: CT and MR evaluation of posterior mediastinal masses. Crit Rev Diagn Imaging 33:311, 1992.
Kersting-Sommerhoff BA, et al: MR imaging of the thoracic aorta in Marfan patients. J Comput Assist Tomogr 11:633, 1987.
Kersting-Sommerhoff BA, et al: Aortic dissection: sensitivity and specificity of MR imaging. Radiology 166:651, 1988.
Kessler R, et al: Magnetic resonance imaging in the diagnosis of pulmonary infarction. Chest 99:298, 1991.
Klein JS, Webb WR: The radiologic staging of lung cancer. J Thorac Imaging 7:29, 1991.
Ko SC, et al: Diagnosis of pulmonary sequestration by magnetic resonance imaging. J Formos Med Assoc 97:220, 1998.
Ko SF, et al: Dissection of retroesophageal aortic diverticulum and descending aorta in a patient with a right aortic arch. Cardiovasc Intervent Radiol 19:438, 1996.
Krinsky GA, et al: Thoracic aorta: comparison of gadolinium-enhanced three-dimensional MR angiography with conventional MR imaging. Radiology 202:183, 1997.
Kuhlman JE, et al: CT and MR imaging evaluation of chest wall disorders. Radiographics 14:571, 1994.
Laurent F, et al: T2-weighted MR imaging of chest: advantages of turbo SE technique. Radiology 189(P):123, 1993.
Lepore V, et al: Magnetic resonance imaging in the follow-up of patients after aortic root reconstruction. Thorac Cardiovasc Surg 44:188, 1996.
Lesko NM, Link KM: Mediastinum and lung. In Stark DD, Bradley WG (eds): Magnetic Resonance Imaging. Vol. 1. 3rd Ed. St. Louis: CV Mosby, 1999.
Leung DA, Debatin JF: Three-dimensional contrast-enhanced magnetic resonance angiography of the thoracic vasculature. Eur J Radiol 7:981, 1997.
Li W, et al: Three-dimensional low dose gadolinium-enhanced peripheral MR venography. J Magn Reson Imaging 8:630, 1998.
Lindsay J Jr: Diseases of the Aorta. Philadelphia: Lea&Febiger, 1994.
Link KM, Lesko NM: The role of MR imaging in the evaluation of acquired diseases of the thoracic aorta. AJR Am J Roentgenol 158:1115, 1992.
Link KM, et al: Magnetic resonance imaging of the mediastinum. J Thorac Imaging 8:34, 1993.
Liu YL, et al: A monitoring, feedback, and triggering system for reproducible breath-hold MR imaging. Magn Reson Med 30:507, 1993.
Lorigan JG, Libshitz HI: MR imaging of malignant pleural mesothelioma. J Comput Assist Tomogr 13:617, 1989.
Loubeyre P, et al: Dynamic contrast-enhanced MR angiography of pulmonary embolism: comparison with pulmonary angiography. AJR Am J Roentgenol 162:1035, 1994.
Loubeyre P, et al: Magnetic resonance imaging evaluation of the ascending aorta after graft-inclusion surgery: comparison between an ultrafast contrast-enhanced MR sequence and conventional cine-MR imaging. J Magn Reson Imaging 6:478, 1996.
Mai VM, Berr SS: MR perfusion imaging of pulmonary parenchyma using pulsed arterial spin labeling techniques: FAIRER and FAIR. J Magn Reson Imaging 9:483, 1999.
Mai VM, et al: Ventilation-perfusion ratio of signal intensity in human lung using oxygen-enhanced and arterial spin labeling techniques. Magn Reson Med 48:341, 2002.
Masani ND, et al: Follow-up of chronic thoracic aortic dissection: comparison of transesophageal echocardiography and magnetic resonance imaging. Am Heart J 131:1156, 1996.
Matsunaga N, et al: Takayasu arteritis: protean radiologic manifestations and diagnosis. Radiographics 17:579, 1997.
Mayo JR: Thoracic magnetic resonance imaging: physics and pulse sequences. J Thorac Imaging 8:1, 1993.
Mayo JR, Mackey A, M ller NL: MR imaging of the lungs: value of short TE spin-echo pulse sequences. AJR Am J Roentgenol 159:951, 1992.
P.197
McDermott VG, et al: Preoperative MR imaging in hyperparathyroidism: results and factors affecting parathyroid detection. AJR Am J Roentgenol 166:705, 1996.
McLoud TC, Flower CDR: Imaging the pleura: sonography, CT, and MR imaging. AJR Am J Roentgenol 156:1145, 1991.
McLoud TC, et al: MR imaging of superior sulcus carcinoma. J Comput Assist Tomogr 13:233, 1989.
McMurdo KK, et al: Normal and occluded mediastinal veins: MR imaging. Radiology 159:33, 1986.
Meaney JFM, et al: Diagnosis of pulmonary embolism with magnetic resonance angiography. N Engl J Med 336:1422, 1997.
Mendelsohn AM, et al: Is echocardiography or magnetic resonance imaging superior for precoarctation angioplasty evaluation? Cathet Cardiovasc Diagn 42:26, 1997.
Meza MP, Benson M, Slovis TL: Imaging of mediastinal masses in children. Radiol Clin North Am 31:583, 1993.
Milas BL, Savino JS: Pseudoaneurysm of the ascending aorta after aortic valve replacement. J Am Soc Echocardiogr 1:303, 1998.
Mitchell DG, et al: Benign adrenocortical masses: diagnosis with chemical shift MR imaging. Radiology 185:345, 1992.
Mohiaddin RH, et al: Magnetic resonance characterization of pulmonary arterial blood flow after single lung transplantation. J Thorac Cardiovasc Surg 101:1016, 1991.
M ller NL: Imaging of the pleura. Radiology 186:297, 1993.
M ller NL, Mayo JR, Zwirewich CV: Value of MR imaging in the evaluation of chronic infiltrative lung diseases: comparison with CT. AJR Am J Roentgenol 158:1205, 1992.
Murayama S, et al: Signal intensity characteristics of mediastinal cystic masses on T1-weighted MR imaging. J Comput Assist Tomogr 19:188, 1995.
Murray JG, et al: Intramural hematoma of the thoracic aorta: MR image findings and their prognostic implications. Radiology 204:349, 1997.
Naidich DP, et al: Intralobar pulmonary sequestration: MR evaluation. J Comput Assist Tomogr 11:531, 1987.
Naidich DP, et al: Congenital anomalies of the lungs in adults: MR diagnosis. AJR Am J Roentgenol 151:13, 1988.
Naidich DP, Zerhouni EA, Siegelman SS: Computed Tomography and Magnetic Resonance of the Thorax. 2nd Ed. New York: Raven Press, 1991.
Napadow VJ, et al: Determination of regional pulmonary parenchymal strain during normal respiration using spin inversion tagged magnetization MRI. J Mag Reson Imag 13:467, 2001.
Nienaber CA, et al: The diagnosis of thoracic aortic dissection by noninvasive imaging procedures. N Engl J Med 328:1, 1993.
Nienaber CA, et al: Comparison of conventional and transesophageal echocardiography with magnetic resonance imaging for anatomical mapping of thoracic aortic dissection: a dual noninvasive imaging study with anatomical and/or angiographic validation. Int J Card Imaging 10:1, 1994.
Nienaber CA, et al: Intramural hemorrhage of the thoracic aorta. Diagnostic and therapeutic implications. Circulation 92:1465, 1995.
Nyman RS, et al: Residual mediastinal masses in Hodgkin disease: prediction of size with MR imaging. Radiology 170:435, 1989.
Ohno Y, Chen Q, Hatabu H: Oxygen-enhanced magnetic resonance ventilation imaging of lung. Eur J Radiol 37:164, 2001.
Ohno Y, et al: Oxygen-enhanced MR ventilation imaging of the lung: preliminary clinical experience in 25 subjects. AJR Am J Roentgenol 177:185, 2001.
Ohno Y, et al: Solitary pulmonary nodules: potential role of dynamic MR imaging in management initial experience. Radiology 224:503, 2002.
Olson EM, et al: Fast SE MR imaging of the chest: parameter optimization, and comparison with conventional SE imaging. J Comput Assist Tomogr 19:167, 1995.
Padovani B, et al: Chest wall invasion by bronchogenic carcinoma: evaluation with MR imaging. Radiology 187:33, 1993.
Panegyres PK, et al: Thoracic outlet syndromes and magnetic resonance imaging. Brain 116:823, 1993.
Poon PY, et al: Mediastinal lymph node metastases from bronchogenic carcinoma: detection with MR imaging and CT. Radiology 162:651, 1987.
Prince MR, et al: Dynamic gadolinium-enhanced three-dimensional abdominal MR arteriography. J Magn Reson Imaging 3:877, 1993.
Pugatch RD: Radiologic evaluation in chest malignancies: a review of imaging modalities. Chest 107:2945, 1995.
Quint LE, et al: Pheochromocytoma and paraganglioma: comparison of MR imaging with CT and I-131 MIBG scintigraphy. Radiology 165:89, 1987.
Rahmouni A, et al: Lymphoma: monitoring tumor size and signal intensity with MR imaging. Radiology 188:445, 1993.
Rehn SM, et al: Non-Hodgkin lymphoma: predicting prognostic grade with MR imaging. Radiology 176:249, 1990.
Remy-Martin M, et al: Diagnosis of pulmonary embolism with spiral CT: comparison with pulmonary angiography and scintigraphy. Radiology 200:699, 1996.
Rich S, Levitsky S, Brundage BH: Pulmonary hypertension from chronic pulmonary thromboembolism. Ann Intern Med 108:425, 1988.
Robbins RC, et al: Management of patients with intramural hematoma of the thoracic aorta. Circulation 88:1, 1993.
Roberts DA, et al: Pulmonary perfusion: respiratory-triggered three-dimensional MR imaging with arterial spin tagging: preliminary results in healthy volunteers. Radiology 212:890, 1999.
Rofsky NM, et al: Aortic aneurysm and dissection: normal MR imaging and CT findings after surgical repair with the continuous-suture graft-inclusion technique. Radiology 186:195, 1993.
Rosado-de-Christenson ML, et al: Extralobar sequestration: radiologic pathologic correlation. Radiographics 13:425, 1993.
Rosado-de-Christenson ML, et al: Thymolipoma: analysis of 27 cases. Radiology 193:121, 1994.
Rubin E, et al: Diagnostic imaging and staging of primary lung cancer. Semin Surg Oncol 9:85, 1993.
Rubin GD, et al: Single breath-hold pulmonary magnetic resonance angiography. Optimization and comparison of three imaging strategies. Invest Radiol 29:766, 1994.
Ruppert K, et al: NMR of hyperpolarized (129)Xe in the canine chest: spectral dynamics during a breath-hold. NMR Biomed 13:220, 2000(a).
Ruppert K, et al: Probing lung physiology with xenon polarization transfer constant (XTC). Magn Reson Med 44:349, 2000(b).
Schiebler ML, Listerud J: Common artifacts encountered in thoracic magnetic resonance imaging: recognition, derivation, and solutions. Top Magn Reson Imaging 4:1, 1992.
Schiebler ML, et al: Suspected pulmonary embolism: prospective evaluation with pulmonary MR angiography. Radiology 189:125, 1993.
Seelos K, et al: T2-weighted turbo-SE MR imaging with electrocardiogram gating for assessment of intra-, peri-, and paracardial masses at 0.5T. Radiology 185(P):118, 1992.
Semelka RC, et al: Single-breath whole-thorax Gd-DTPA-enhanced MR imaging of pulmonary nodules and interstitial disease: comparison with CT. Radiology 181(P):305, 1991.
Shields TW: Screening, staging, and diagnostic investigation of non-small cell lung cancer patients. Curr Opin Oncol 3:297, 1991.
Siegel MJ: Chest applications of magnetic resonance imaging in children. Top Magn Reson Imaging 3:1, 1990.
Soler R, et al: MR imaging of pseudocoarctation of the aorta: morphological and cine-MR imaging findings. Comput Med Imaging Graph 19:431, 1995.
Soler R, et al: Magnetic resonance imaging of congenital abnormalities of the thoracic aorta. Eur J Radiol 8:540, 1998.
Solomon SL, et al: Thoracic aortic dissection: pitfalls and artifacts in MR imaging. Radiology 177:223, 1990.
Spring BI, Schiebler ML: Normal anatomy of the thoracic inlet as seen on transaxial MR images. AJR Am J Roentgenol 157:707, 1991.
Spritzer CE, et al: Detection of deep venous thrombosis by magnetic resonance imaging. Chest 104:54, 1993.
Stanson AW, et al: Penetrating atherosclerotic ulcers of the thoracic aorta: Natural history and clinicopathologic correlations. Ann Vasc Surg 1:15, 1986.
Stock KW, et al: Demonstration of gravity-dependent lung perfusion with contrast-enhanced magnetic resonance imaging. J Magn Reson Imaging 9:557, 1999.
Taylor AM, et al: Magnetic resonance navigator echo diaphragm monitoring in patients with suspected diaphragm paralysis. J Magn Reson Imaging 9:69, 1999.
Teh BT: Thymic carcinoids in multiple endocrine neoplasia type 1. J Intern Med 243:501, 1998.
Turetschek K, et al: Double inversion recovery imaging of the brain: initial experience and comparison with fluid attenuated inversion recovery imaging. Magn Reson Imaging 16:127, 1998.
P.198
Vesely TM, et al: MR imaging of partial anomalous pulmonary venous connections. J Comput Assist Tomogr 15:752, 1991.
Wagshul ME, et al: In vivo MR imaging and spectroscopy using hyperpolarized 129Xe. Magn Reson Med 37:809, 1997.
Webb WR, Golden JA: Imaging strategies in the staging of lung cancer. Clin Chest Med 12:133, 1991.
Webb WR, Sostman HD: MR imaging of thoracic disease: clinical uses. Radiology 182:621, 1992.
Webb WR, et al: CT and MR imaging in staging non-small cell bronchogenic carcinoma: report of the Radiologic Diagnostic Oncology Group. Radiology 178:705, 1991.
Weinreb JC, Mootz A, Cohen JM: MR imaging evaluation of mediastinal and thoracic inlet venous obstruction. AJR Am J Roentgenol 146:679, 1986.
Weinreb JC, Naidich DP: Thoracic magnetic resonance imaging. Clin Chest Med 12:33, 1991.
Wielopolski PA: Pulmonary arteriography. MR Imaging Clin North Am 1:295, 1993.
Wielopolski PA, Haacke EM, Adler LP: Three-dimensional MR imaging of the pulmonary vasculature: preliminary experience. Radiology 183: 465, 1992.
Winer-Muram HT, et al: Primitive neuroectodermal tumors of the chest wall (Askin tumors): CT and MR findings. AJR Am J Roentgenol 161:265, 1993.
Wolffe KA, et al: Aortic dissection: atypical patterns seen at MR imaging. Radiology 181:489, 1991.
Wolffe KA, et al: Accuracy of MR angiography in depicting chronic pulmonary thromboembolic disease: evaluation at the segmental and lobar levels. Radiology 193(P):311, 1994(a).
Wolffe KA, et al: Utility of MR imaging in distinction between chronic pulmonary thromboembolic disease and primary pulmonary hypertension. Radiology 193(P):312, 1994(b).
Wyttenbach R, Vock P, Tschappeler H: Cross sectional imaging with CT and/or MR imaging of pediatric chest tumors. Eur J Radiol 8:1040, 1998.
Yamada I, Numano F, Suzuki S: Takayasu arteritis: evaluation with MR imaging. Radiology 188:89, 1993.
Yankelevitz DF, et al: Lung cancer: evaluation with MR imaging during and after irradiation. J Thorac Imaging 9:41, 1994.
Zheng J, et al: Combined MR proton lung perfusion/angiography and helium ventilation: potential for detecting pulmonary emboli and ventilation defects. Magn Reson Med 47:433, 2002.
EAN: 2147483647
Pages: 203