12.6 Sample Benchmark Results
| only for RuBoard - do not distribute or recompile |
12.6 Sample Benchmark Results
This section contains results from a Web Polygraph benchmark of a Squid cache. The data shown here is not an official Polygraph result, but it uses the same PolyMix-3 workload that we used for the third industry Cache-Off.
For this test, Squid is running on a Compaq Proliant system with an Intel Pentium III/450 processor, 1GB of RAM, six 9GB SCSI disks, and an Intel fast Ethernet interface. The operating system is FreeBSD-4.1 with a kernel specifically tuned for Squid. The Squid version is 2.4.DEVEL4.
PolyMix-3 has three input parameters: cache size, peak throughput, and fill rate. For this test, the cache size is 41G B, the peak throughput is 130 requests per second, and the fill rate is 115 requests per second. Another characteristic of the workload is its different phases. PolyMix-3 has three interesting phases: fill , top1 , and top2 . There are actually transitional phases in between, but we won't discuss them. The fill rate is the request rate during the fill phase, which can be different from the peak throughput for the top phases. During the fill phase, the hit ratio is only 5%, whereas it is about 57% during the top phases. During the fill phase, the cache is mostly writing objects to disk, with relatively few reads. Thus, a cache may be able to support a higher throughput during the top2 phase, when it is reading more and writing less than it was during the fill phase.
These results were created by running Polygraph's ReportGen scripts. Rather than show all of the details that ReportGen provides, we'll look only at the three most interesting metrics: throughput, response time, and hit ratio. If we want to compare this result to another PolyMix-3 run, we usually look at the metrics averaged during the top2 phase. The ReportGen script puts this information in an executive summary table as shown in Table 12-1.
Table 12-1. Summary of Polygraph Results
| Metric | Value |
|---|---|
| Throughput | 130.36 req/sec |
| Hit response time | 0.303 sec |
| Miss response time | 2.802 sec |
| Overall response time | 1.443 sec |
| Cache hit ratio | 57.26% |
12.6.1 Throughput
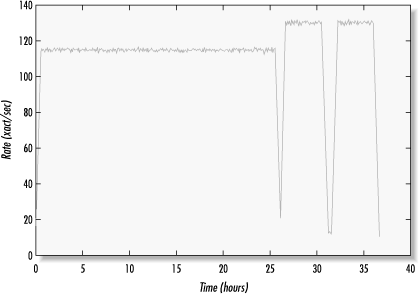
First, let's look at the throughput. Remember that this is an input parameter; that is, I told Polygraph what throughput to use. In Figure 12-1, you can see the three phases clearly: first is the long fill phase followed by the top1 and top2 phases. The PolyMix-3 workload is designed to fill the cache twice. In other words, it would require twice the cache size to store every cachable response transferred during the fill phase. In this case, it takes about 25 hours to reach that point.
Figure 12-1. Throughput versus time

You can see that the throughput during the fill phase is 115 requests per second. During the top1 and top2 phases, Polygraph uses the peak throughput, which is 130 requests per second. Each top phase lasts for four hours. In between are some short idle phases.
12.6.2 Response Time
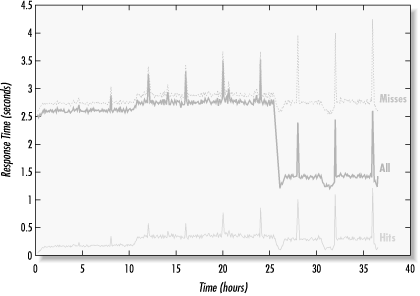
The response time trace is shown in Figure 12-2. One of the first things you notice about this graph is the spikes that occur every four hours. Initially the spikes are small, but they increase with time. They are caused by a cron job on the Squid box that prevents certain log files from growing too large. While Squid is cleaning up the logs, it has a hard time keeping up and some requests are delayed. After about a minute, Squid catches up and response time returns to normal levels.
Figure 12-2. Response time versus time

The three lines on the response time graph represent cache hits, cache misses, and all requests combined. During the fill phase, the All line is just slightly below the Miss line. This is because 95% of all requests are cache misses, and only 5% are hits. During the top phases, you can see that the All line drops significantly because about 57% of requests are now cache hits.
Notice the slight increase in All response times after 10 hours. This corresponds to the point in time when Squid begins removing cached objects. The delete operations increase disk activity and affect the time to read and write object data.
12.6.3 Hit Ratio
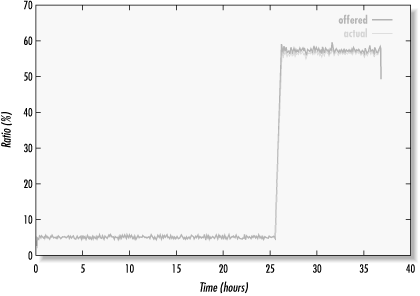
Figure 12-3 shows the cache hit ratio trace. Here we see both the offered and actual hit ratios. A particular product may not achieve the ideal hit ratio for any number of reasons, such as insufficient disk space, overload conditions, and lack of support for certain HTTP features. In this case, Squid gets pretty close to the offered hit ratio, but not quite. During the fill phase the two are very close. However, you can see a gap when the hit ratio jumps to 57%. It looks like the gap gets smaller as the test continues after that point.
Figure 12-3. Hit ratio versus time

12.6.4 Other Results
Most caching vendors recognize the value in publishing benchmark results for their products. You can find publicly available Polygraph results by visiting http://www.web-polygraph.org and http://www.measurement-factory.com.
| only for RuBoard - do not distribute or recompile |