Oracle Application Manager
|
| < Day Day Up > |
|
OAM provides an HTML-based administration console (or dashboard) through which Apps administrators can perform a wide variety of tasks. While it does not yet have OEM's full library of self-fixes, script scheduling, and automated notification of trouble spots, it does bring with it many features that an Apps administrator will find useful. Further than this, however, there are certain tasks, depending on which modules that you have implemented, that you can now perform only through this interface. If you are beyond Version 11.5.7, it is the only means by which you can configure and administer the Oracle Workflow product.
Through OAM, you can, in one simple interface, monitor the status of your applications system, including the database, the Apps tier, Concurrent Managers and Concurrent Programs, and Oracle's Workflow process. Further, you can control system processes on the Applications tier and submit concurrent requests directly through the interface. Charts and graphs provide an at-a-glance summary of the state of your system, while allowing for further drill down to detailed information. It includes diagnostic tools for many of your Applications specific components and displays for errors reported by Transaction Managers and concurrent requests. Monitoring tools include the ability to monitor currently running forms and sql queries and through these assist in helping to determine problems areas in the system and poorly running sql statements via an explain plan.
OAM can be navigated to by way of the Logon Options screen by selecting the Oracle Applications Manager link (see Figure 13.1) rather than the typical PHP link that most administration has been done through. Once you have gotten to the Logon screen, log into the OAM (see Figure 13.2), making sure that you select the correct DAD from the drop-down box.
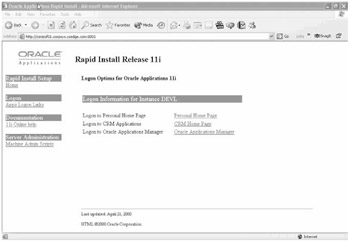
Figure 13.1: Administration Navigation Choice
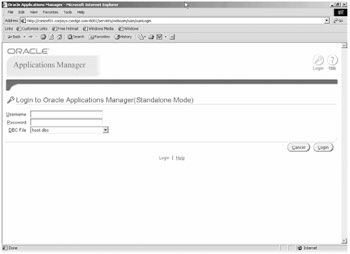
Figure 13.2: Applications Manager Logon Screen
You will select what actions you want to follow from the next screen (see Figure 13.3), the OAM home page. Your options from here are to navigate to Configuration, Activity, Patches, or Site Map or select from the drop-down list to navigate to Workflow Manager, Service Fulfillment Manager, or to Applications Usage.
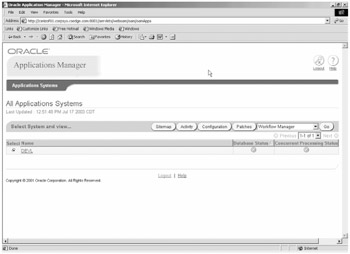
Figure 13.3: Oracle Applications Manager Home Page
Configuration
By navigating to the Configuration screen, you can examine the system settings for your entire system (DEVL in the case of Figure 13.4) and see the version that your application is currently at, the number of products that you have installed, and the number of invalid objects that you currently have in the database. You can see your middle tier host, its OS, and what services are running on that tier. Further, you can see the information about your database tier, including its host name, SID, version, language and character set, and (at a click of the link) all initialization parameters. These interfaces look a lot like the 9iAS browser-based OEM interface. Figure 13.5 (the other half of the Configuration screen) shows you the access to the configuration settings for the Concurrent Managers, Forms Server, and the Web Server settings. While these, at this time, will not give you full access to all settings and allow you to change some of what is there, it does provide a quicker look into the configuration than might be available in other fashions.
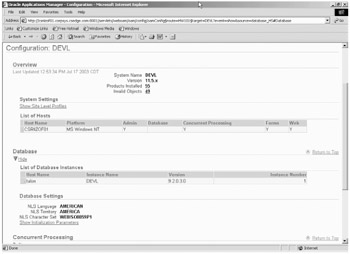
Figure 13.4: Configuration Screen Top
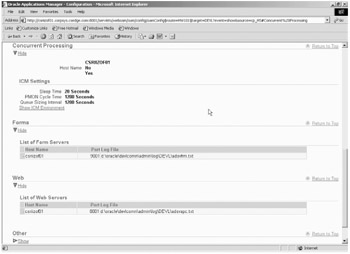
Figure 13.5: Configuration Screen Bottom
Activity
Figure 13.6 shows a sample of the Activity Monitor page. It presents, graphically, the current state of the database and all active sessions of the database. Not only can you see that it is up, but what sessions are active, and what the resource usage is for those sessions. By selecting the bar in the graph or the color associated with that bar from the legend, you can drill out for further information on that particular aspect of the database. The same is true for the Concurrent Requests graph. In this case, there are pending requests, but none currently running on the system, no inactive managers, no requests completed in the last hour, and none that are waiting on locks. You will notice that many of the monitored aspects correspond to the tests in the OEM version of OAM, but the one that is accessible through the Oracle E-Business Suite is licensed with the product and not acquired through an add-on license. As such, it is less robust than the OEM model, but it is efficient at what information it provides to you.
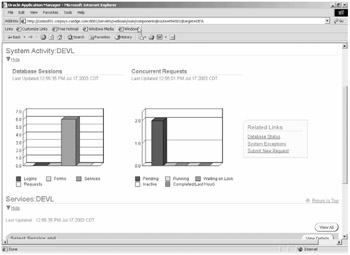
Figure 13.6: System Activity
Patches
The OAM interface provides at-a-glance information on patches that have been applied to the system. You first have to provide search criteria (see Figure 13.7) and based on the criteria, OAM returns a list of all patches that were applied that meet those specifications (see Figure 13.8). There is a more advanced search capability and the ability to search by what files were overlaid by the patch, if that is the information you are looking for, which is often the case when there are customized versions of forms and reports on a system.
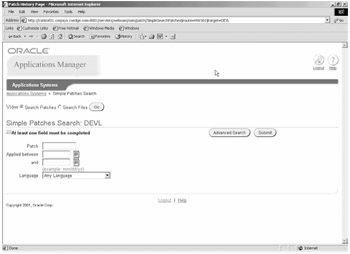
Figure 13.7: Sample Search Screen for the Patches Search
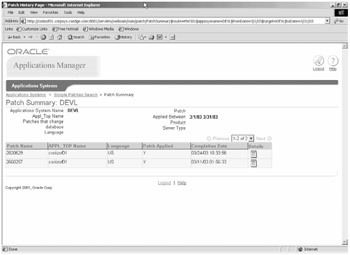
Figure 13.8: Results Returned by the Search in Figure 13.7
You can make this search as broad or as narrow as you choose. If you know what file you are looking for, that can be your criteria in the Search Files search. If you want all patches applied to the system or all patches applied this year, you can provide date ranges for that as well. You can even narrow the search to all patches for a particular language and compare those results with another language so that you can see where you might have holes.
The set of patches that are returned for the search on this particular system are seen in Figure 13.8. The details on this screen are somewhat sketchy, but by selecting the icon under the Details column, you can drill out to the details of what drivers were applied by that patch, the start date and time of the patch, and the directory where that patch can be located later (see Figure 13.9). Being able to get timing information may prove useful in comparing two systems or in planning for the next set of patches.
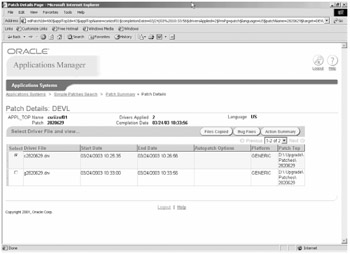
Figure 13.9: Details of the Patch from the Results Screen
From the Details screen in Figure 13.9, you can further drill out to find out information on the summary of actions that were taken by the patch driver selected, what bugs this patch fixed, and what files were copied by the copy driver.
Having the ability to report on this information quickly and in a format that prints nicely and formats well for presentation will allow you to show, in just a few minutes, what actions have been performed on your system. You may find that this information is also in a format that is easily sent to Oracle Support for assistance on trouble cases. This is the interface that I have, so far, spent the most time using in real life applications.
Site Map
Ordinarily, a site map is not something that gets used on a regular basis. In the case of the OAM, it is an invaluable tool in quick navigation if you know exactly what you want to do. As you can see in Figure 13.10, from here you can navigate to any screen directly and access that screen's tool set.
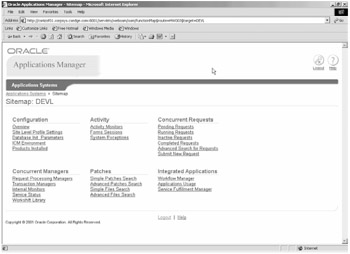
Figure 13.10: Site Map
Concurrent Requests and Concurrent Managers
Not only can you graphically see the status of the concurrent requests on your system, you can examine the settings of the Concurrent Managers and the details on the concurrent requests as well. You can do detailed searches for concurrent jobs (see Figure 13.11) and drill from screen to screen, Concurrent Manager to concurrent request, and back again to determine what exactly is taking place in many cases.
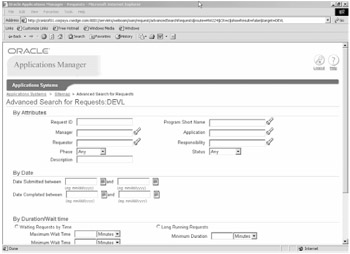
Figure 13.11: Concurrent Manager Advanced Search
One of the most useful tools in the whole Concurrent Manager/concurrent request part of this system is the ability to easily find and pull up the out files created by the job and the log files (replete with error message in a printable or savable format) associated with a particular concurrent request. Be careful who has access through sysadmin rights to this information; some out files may be sensitive. It saves a great deal of time being able to navigate to that functionality here, rather than having to go to the log and out directories and hunt for the files to provide in support of an iTAR. Where, in applications, you cannot select portions, save the file as another name, or even print a log file to support error documentation, through the concurrent requests screen, you can quickly navigate to that section and save yourself time and aggravation in other tasks.
Workflow
In the 11.5.7 and 11.5.8 versions of the Oracle E-Business Suite, configuration and administration of workflow is accomplished through the OAM interface. Figure 13.12 shows the new interface screen that will be the central launching point for all workflow management tasks.
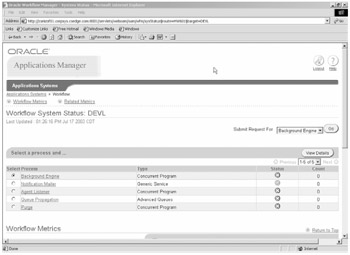
Figure 13.12: Workflow Main Page
Applications Usage
The Applications Usage Screen (see Figure 13.13) allows you to determine what products are on your system and in what status they currently exist or determine how many users you have configured on the system that are using each product group.
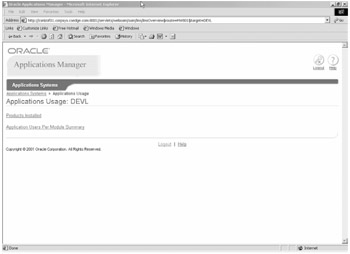
Figure 13.13: Applications Usage Choice
Has anyone ever asked what products are installed as shared or fully licensed on your system? Have you ever been faced with having to determine just how many people are using each of the licensed products and not been able to easily provide those answers. Another neat feature of the OAM is the ability to not only see what products are being used in any way on the system (see Figure 13.14), but also how many users are currently configured to use those products (see Figure 13.15). The installed products listing is often very useful when looking at patch installation planning and determining what patches you have to pay attention to applying, what can be ignored completely, and what patches need to be examined more fully to make a determination.
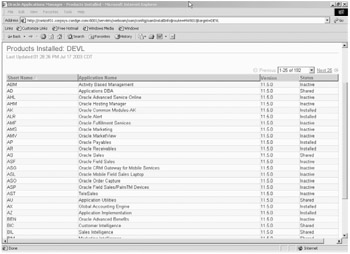
Figure 13.14: Installed Products
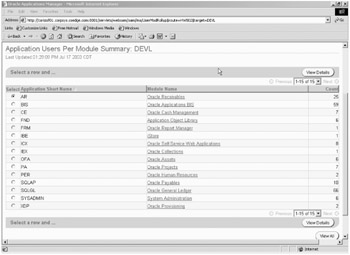
Figure 13.15: Applications Users per Module
|
| < Day Day Up > |
|
EAN: 2147483647
Pages: 122