Section 27. MSAContinuous
27. MSAContinuousOverviewProcess variation affects how resulting products and services appear to Customers. However, what you (and ultimately the Customer) see as the appearance does not usually include only the variability in the entity itself, but also some variation from the way the entity is measured. A simple example of this is to pick up a familiar object, such as a pair of glasses. If you were to measure the thickness of the middle of the left lens and then you handed the same pair of glasses to three other people, it is highly likely that there would be a difference in answers between everyone. It is also highly likely that if someone handed you the same pair of glasses later (without you knowing it was the same pair) and asked you to measure again, you would come to a different answer or conclusion. The pair of glasses itself has not changed; the difference in answers is purely due to the Measurement System and specifically errors within it. The higher the Measurement Error, the harder it is to understand the true process capability and behavior. Thus it is crucial to analyze Measurement Systems before embarking on any Process Improvement activities. The sole purpose of a Measurement System in Lean Sigma is to collect the right data to answer the questions being asked. To do this the Team must be confident in the integrity of the data being collected. To confirm Data Integrity the Team must know
To answer these questions, Data Integrity is broken down into two elements:
And after Validity is confirmed (some mending of the Measurement System might be required first):
Validity is covered in "MSAValidity" in this chapter. Reliability is dependent on the data type. Continuous Measurement Systems are covered here with a tool called Gage Repeatability and Reproducibility[44] (Gage R&R); Attribute Measurement Systems are covered in the section "MSAAttribute" in this chapter.
Gage R&R is an audit conducted on a Continuous Measurement System which is done using 23 people and multiple entities to measure. Each person measures every entity at least twice and from the ensuing data the tool determines
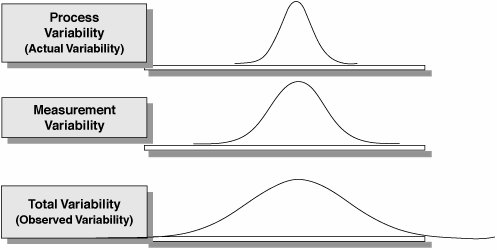
Belts often think that the Gage R&R Study is just on the Gage itself, but the Study examines the whole Measurement System including the samples, people, techniques, and methods. This becomes important in "Interpreting the Output" in this section. Many Belts confuse a Gage R&R Study with calibration of a piece of equipment; the two are different. Calibration considers only the average reading of a gage. The calibrator measures a known entity using the Measurement System 1015 times and then takes the average of the readings. The Measurement System is then adjusted so that it is zeroed correctly (i.e., the mean is changed and any bias removed). This is generally quite straightforward for many Measurement Systems, similar to zeroing a set of bathroom scales. Gage R&R is significantly different and often far more difficult, in that it analyzes the variation in the measurement system. The reason for doing this is that the variability detected in the process (entities measured) is actually comprised of the true process variation, but also the variability in the Measurement System (see Figure 7.27.1):
Or in statistical terms: Figure 7.27.1. The effect of Measurement System Variation on the Total Variation in a process. Thus, to effectively see the variation in the process data, the variability due to the Measurement System should be small. The purpose of a Gage R&R Study is to determine
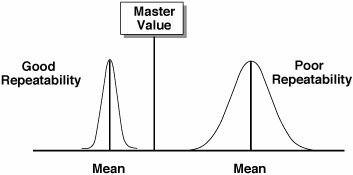
As previously mentioned, the Study breaks the total observed variation in the process down into the two components of Actual variation and Measurement System variation. It also takes the Measurement System Variation and breaks it into the variation due to Repeatability plus the variation due to Reproducibility: Repeatability is the inherent variability of the Measurement System and is the variation that occurs when repeated measurements are made of the same variable under absolutely identical conditions. It is the variation between successive measurements of the same sample, of the same characteristic, by the same person using the same instrument. Figure 7.27.2 shows a graphical representation of Repeatability. Poor Repeatability causes an increase in decision error. When the same person looks at the same attribute and estimates different values then that person likely makes different decisions based on those estimates. Some of these decisions are the wrong decision! Figure 7.27.2. A graphical representation of Repeatability.[45]
Reproducibility is the variation that results when different people are used to make the measurements using the same instrument when measuring the identical characteristic with different conditions (time, environment, and so on). When two or more individuals return the same value for a given attribute, that measure is said to be Reproducible. A graphical representation is shown in Figure 7.27.3. When Reproducibility is not present, the value of a metric depends on who collects the measurements. Figure 7.27.3. A graphical representation of Reproducibility.[46]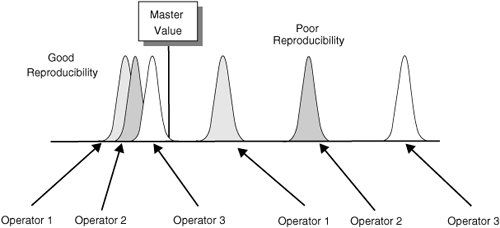
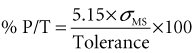
To effectively use a Gage R&R Study, it is important to understand the purpose of the Measurement System in question. Is it a "production gage" used to determine if product is in or out of specification, or is it a tool to measure a process characteristic in a project to improve process performance by reducing process variation? In the former it is important to understand the size of the Measurement System error with respect to the size of the specifications. The associated metric is known as the "Precision to Tolerance Ratio" and is defined as The P/T Ratio represents the percent of the tolerance taken up by measurement error.[47] The metric includes both Repeatability and Reproducibility. An excellent Measurement System has a P/T Ratio less than 10%. A value of 30% is barely acceptable. It is important to note that having the correct value for the Tolerance is crucial. In many cases, the specifications are too tight or too loose, which can be misleading.
If the Measurement System is used for process improvement, then a more appropriate metric is the %R&R, which represents the percentage of the Total Variation taken up by measurement error: The metric includes both Repeatability and Reproducibility. An excellent Measurement System has a %R&R less than 10%. A value of 30% is barely acceptable. The final metric of interest to a Lean Sigma Belt is Discrimination, which represents the number of decimal places that can be measured by the system. Increments of measure should be about one-tenth of the width of the product specification or process variation (depending on the use of the Measurement System). LogisticsConducting a Gage R&R Study is about careful planning and data collection. This is certainly a Team sport because at least two appraisers are required, and it is unlikely that Belts apply the Measurement System in their regular job (i.e., the Belt almost certainly won't be one of the appraisers used in the MSA). Planning the MSA takes about two hours, which usually includes a brief introduction to the tool made by the Belt to the rest of the Team and sometimes to the other appraisers. Data collection (conducting the appraisals themselves) can take anywhere between an hour and a week, depending on the complexity of the measurement. RoadmapThe roadmap to planning, data collection, and analysis is as follows:
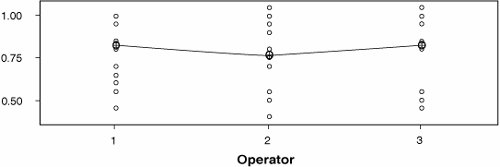
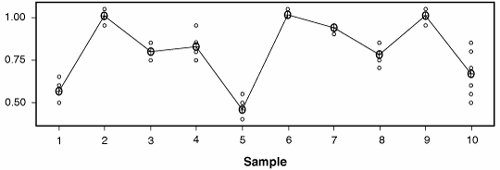
Interpreting the OutputStatistical software packages generally produce both analytical and graphical analysis information. Each graph shows a different piece of the puzzle. Belts often try to read too much into each of the graphs; it is the combined story from all of the graphs that describes the Measurement System. Figure 7.27.4 shows an example Xbar-R Chart from a Gage R&R Study (for more details see "Control Charts" in this chapter). For the Xbar-R Chart, if the averages for each operator are different, then the reproducibility is suspect. The majority of the points on the chart should fall outside the control limits consistently for all operators. If there are no points outside the control limits, it is generally because samples were not selected to cover the full range of the process (i.e., there was not enough Part-To-Part variation). Figure 7.27.4. An example of a Gage R&R Xbar-R Chart (output from Minitab v14).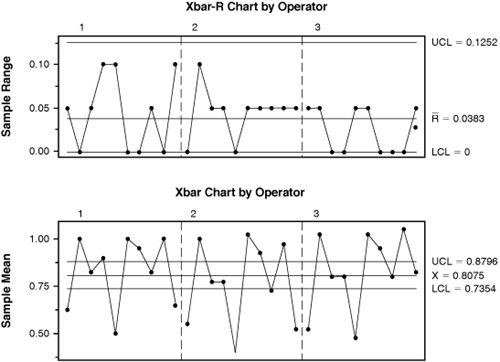 The Range Chart should show a process that is in control. The Ranges are the differences between trials and should not show any special causes of variation (i.e., remain in control). If a point is above the UCL, the operator is having a problem making consistent measurements. The Range Chart can also help identify inadequate discrimination; there should be least five distinct levels within the Control Limits. Also, if there are five or more levels for the range but more than 1/4 of the values are zero, then Discrimination is suspect. Repeatability is questionable if the Range Chart shows out-of-control conditions. If the Range Chart for an operator is out-of-control and the other Charts are not, then the method is probably suspect. If all operators have ranges out-of-control, the system is sensitive to operator technique. Figure 7.27.5 shows an example of an Operator-Part Interaction Plot. For a reliable Measurement System, the lines should follow the same pattern and be reasonably parallel to each other. Crossing lines between operators indicates significant interactions. Also the part averages should vary enough that the differences between parts are clear. Figure 7.27.5. An example of Gage R&R Operator-Part Interaction Plot (output from Minitab v14).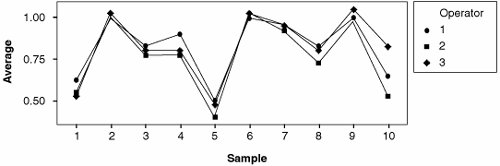 Figure 7.27.6 shows an example of a By Operator graph, which shows the average value (Circle) and the spread of the data for each operator. The spread should be similar across all operators and there should be a flat line across the means of the operators. Figure 7.27.6. An example of a Gage R&R By Operator Plot (output from Minitab v14). Figure 7.27.7 shows an example of a By Part graph. The graph shows the average (circles) and spread of the values for each sample. There should be minimal spread for each part (all the circles on top of each other), but variability between samples(different means). Figure 7.27.7. An example of a Gage R&R By Part Plot (output from Minitab v14). Figure 7.27.8 shows an example of a Components of Variation graph. The Gage R&R bars should be as small as possible, driving the Part-to-Part bars to be larger. This is better understood by looking at the analytical representation of the same data, which is shown in Figure 7.27.9. Figure 7.27.8. An example of a Gage R&R Components of Variation Plot (output from Minitab v14).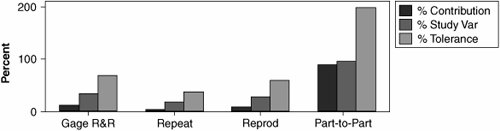
The key metrics to look at in Figure 7.27.9 are
Remember, the measurement system must be mended before collecting the data! The graphical and analytical results help guide the Team in understanding where to focus the improvement. Improvement could be as simple as (re)training appraisers or it could be a project in itself. For more details see the Problem Category for Measurement System Improvement in Chapter 3, "Global Process Problems." Other OptionsMSA is a broad, relatively well-documented subject area.[48] The approach shown in this section is for a straightforward non-destructive Measurement System. When considering other variations, such as destructive testing or on-line measures (where there are no operators), things become trickier. Analysis of this kind is beyond the scope of this book.
| |||||||||||||||||||||||||||||||||||||||||||||||||||||||||||||
EAN: 2147483647
Pages: 138